


 National Land Cover Database: Improving on a 30-Year Legacy")
 Tool Demo")
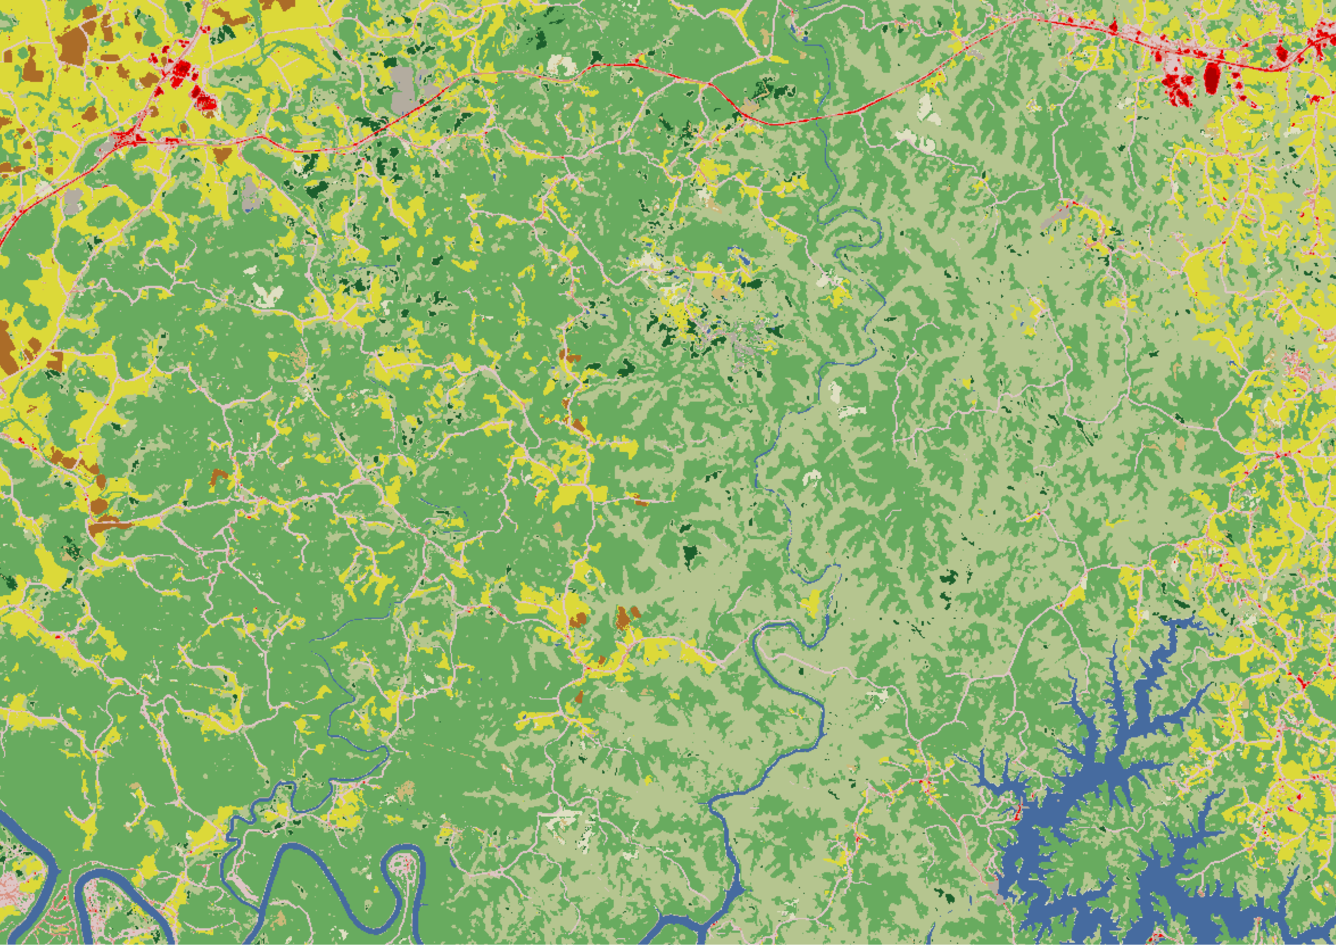
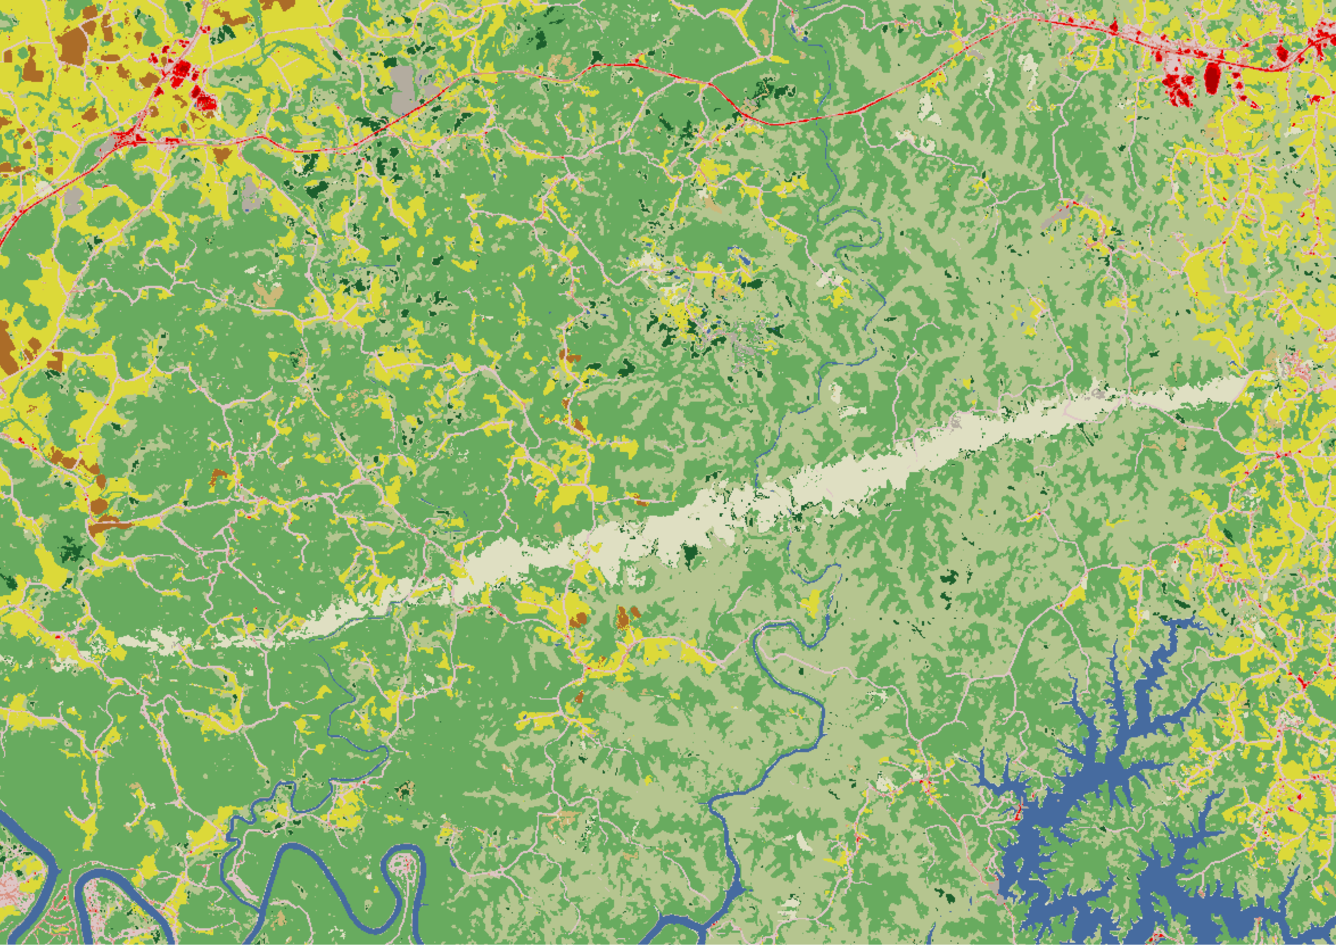
MRLC Enhanced Visualization and Analysis (EVA) Tool Demo
MRLC Enhanced Visualization and Analysis (EVA) Tool DemoThis video is a demonstration of the EVA Tool. It was conducted during the January 20, 2026 webinar. To watch the full webinar please visit: https://www.usgs.gov/media/videos/visualizing-land-cover-mrlc-tools.
 Viewer Tool Demo")