
Water Use & Water Supply Capabilities at MD-DE-DC
Delaware Agricultural Shallow Groundwater Monitoring Network
Unconfined aquifers susceptible to contamination from surface
The Affects of Heavy Urbanization on a Watershed
Hydrogeology and Shallow Groundwater Quality in the Tidal Anacostia River Watershed, Washington, D.C
MD-DE-DC Water Science Center Capability Sites
We have the data, we have the people, we have the technology...
The MD-DE-DC WSC works with state and local agencies to collect, estimate, review, and compile water use information. Data are used in USGS groundwater and watershed models, and other USGS studies. The data are also compiled and incorporated into the USGS national estimates of water-use. WSC staff currently participate in various national water use projects focused on improving water use estimates for various categories of use including thermo-electric power generation, irrigation, public supply, and self-supplied domestic.
Estimated use of water in the United States

Water use in the United States in 2015 was estimated to be about 322 billion gallons per day (Bgal/d), which was 9 percent less than in 2010.
Comprehensive Assessment of Water Supply in Maryland

Several state and local agencies, including the USGS, MDE, MGS, and Maryland DNR, took a comprehensive look at water resources in Maryland.
Drought forecasting in northeastern United States

USGS Water Science Centers in the northeast U.S. have combined resources and methodologies to produce a factsheet describing the drought forecasting techniques to predict droughts for streamflow and groundwater.


Water supply in the area that the MD-DE-DC WSC serves comes surface water (streams and rivers), groundwater (fractured rock aquifers and Coastal Plain aquifers), and reservoirs. Water is a vital component of human existence, as well as critical to all forms of life. In order to protect and preserve this resource for future generations, we must have a baseline of information to make decisions. Decision and policy makers must know the answers to three fundamental questions: where is the water used, how is it used, and how much is used.

While Maryland, Delaware and the District of Columbia all fall within the green zone, as far as water use goes, our placement on that list comes from years of hard-fought regulation, convincing policy makers that water, although seemingly an endless resource, is anything but. In fact, in some parts of the world it can be as valuable as gold. Especially when it's clean, potable water.
Below is a list of projects related to fields of Water Use and Water Supply

Water Use in the United States

Integrated Water Availability Assessments Fundamentals

USGS National Streamgaging Network

Next Generation Water Observing System (NGWOS)

Water-Use Terminology

Monitoring Water-Quality Changes in the Chesapeake Bay Watershed
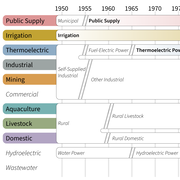
Changes in Water Use Categories

Monitoring Water-Quality Response of Conservation Practices in the Bucks Branch Watershed, Sussex County, Delaware

Hydrogeology and Groundwater Quality of the Anacostia River Watershed
Below are some frequently asked questions sometimes heard in the fields of Water Use and Water Supply
In addition to FAQs, please refer to our glossaries
Water Basics Glossary
Hydrologic Definitions
Water Science-Glossary of Terms
Water Resources Data - Definition of Terms
Glossary of water-use terminology
A-Z Index of Hydrologic Terms

Where can I get my well water tested? Where can I get my well water tested?
Some counties offer free well water testing, so check with your county first. If they don't, use this EPA website to find a list of state-certified laboratories in your area that do water testing, or contact your county or state health department or your State Certification Officer for assistance. Prices will vary depending on the laboratory and the test(s), but most people consider the cost to be...

Where can I get real-time and historical streamflow information? Where can I get real-time and historical streamflow information?
Water Data for the Nation (WDFN) is the home for USGS streamflow, groundwater, and water quality data. Through WDFN you can find different tools to look at historic and real-time streamflow data, find sites of interest, and access using USGS water data application programming interfaces (APIs). State pages (e.g., California) allow you to discover real-time data in your state, or you can create a...

How can I find the depth to the water table in a specific location? How can I find the depth to the water table in a specific location?
The depth to the water table can change (rise or fall) depending on the time of year. During the late winter and spring when accumulated snow starts to melt and spring rainfall is plentiful, water on the surface infiltrates into the ground and the water table rises. When water-loving plants start to grow again in the spring and precipitation gives way to hot, dry summers, the water table falls...

What is the Earth's "water cycle?" What is the Earth's "water cycle?"
The water cycle, also known as the hydrologic cycle, describes where water is stored on Earth and how it moves. Water is stored in the atmosphere, on the land surface, and below the ground. It can be a liquid, a solid, or a gas. Liquid water can be fresh or saline (salty). Water moves between the places it is stored. It moves at large scales (through watersheds, the atmosphere, and below the Earth...

Where can I find information about my local drinking water supply? Where can I find information about my local drinking water supply?
The best way to learn about your local drinking water quality is to read the annual drinking water quality report/consumer confidence report that water suppliers now send out by July 1 of each year. The reports are often sent out with water bills, but they may be sent separately. The reports tell where drinking water comes from, what contaminants are in it, and at what levels. The U.S...

Does the use of pesticides affect our Nation's water quality? Does the use of pesticides affect our Nation's water quality?
Pesticide use in the United States has increased because not only must we supply our exploding population with food, but crops and food are also grown for export to other countries. The United States has become the largest producer of food products in the world, partly owing to our use of modern chemicals (pesticides) to control the insects, weeds, and other organisms that attack food crops. But...

Is saline water used for anything? Is saline water used for anything?
In the U.S., about 13 percent of all water used is saline water. But saline water can only be used for certain purposes. The main use is for thermoelectric power-plant cooling. About 5 percent of water used for industrial purposes is saline, and about 53 percent of all water used for mining purposes is saline. Saline water can be desalinated for use as drinking water by putting it through a...

Where can I find information about bottled water? Where can I find information about bottled water?
Bottled water is regulated by the U.S. Food and Drug Administration and by individual states. For general information about bottled water, sources include the International Bottled Water Association and NSF International. Learn More: Water bottling across the U.S. - interactive map Water Use - Withdrawals for Bottled Water

How much natural water is there? How much natural water is there?
Earth is estimated to hold about 1,386,000,000 cubic kilometers of water. The breakdown of where all that water resides is estimated as follows: Oceans (saline) 1,338,000,000 cubic kilometers Ice caps and glaciers (fresh) 24,064,000 cubic kilometers Groundwater (fresh and saline) 23,400,000 cubic kilometers Streams, lakes, swamps (fresh) 104,590 cubic kilometers Lakes (saline) 85,400 cubic...

Why does my drinking water look cloudy sometimes? Why does my drinking water look cloudy sometimes?
Once in a while you get a glass of water that looks cloudy; maybe milky is a better term. After a few seconds it miraculously clears up! The cloudiness is due to tiny air bubbles in the water. Like any bubbles, the air rises to the top of the water and goes into the air, clearing up the water. The water in the pipes coming into your house might be under a bit of pressure. This causes gases (air)...

How much water is used by people in the United States? How much water is used by people in the United States?
Since 1950, the USGS has collected and analyzed water-use data for the United States and its Territories. That data is revised every 5 years. As of 2015, the United States uses 322 billion gallons of water per day (Bgal/day). The three largest water-use categories were irrigation (118 Bgal/day), thermoelectric power (133 Bgal/day), and public supply (39 Bgal/day), cumulatively accounting for 90...
The MD-DE-DC WSC works with state and local agencies to collect, estimate, review, and compile water use information. Data are used in USGS groundwater and watershed models, and other USGS studies. The data are also compiled and incorporated into the USGS national estimates of water-use. WSC staff currently participate in various national water use projects focused on improving water use estimates for various categories of use including thermo-electric power generation, irrigation, public supply, and self-supplied domestic.
Estimated use of water in the United States
Water use in the United States in 2015 was estimated to be about 322 billion gallons per day (Bgal/d), which was 9 percent less than in 2010.
Comprehensive Assessment of Water Supply in Maryland
Several state and local agencies, including the USGS, MDE, MGS, and Maryland DNR, took a comprehensive look at water resources in Maryland.
Drought forecasting in northeastern United States
USGS Water Science Centers in the northeast U.S. have combined resources and methodologies to produce a factsheet describing the drought forecasting techniques to predict droughts for streamflow and groundwater.
Water supply in the area that the MD-DE-DC WSC serves comes surface water (streams and rivers), groundwater (fractured rock aquifers and Coastal Plain aquifers), and reservoirs. Water is a vital component of human existence, as well as critical to all forms of life. In order to protect and preserve this resource for future generations, we must have a baseline of information to make decisions. Decision and policy makers must know the answers to three fundamental questions: where is the water used, how is it used, and how much is used.
While Maryland, Delaware and the District of Columbia all fall within the green zone, as far as water use goes, our placement on that list comes from years of hard-fought regulation, convincing policy makers that water, although seemingly an endless resource, is anything but. In fact, in some parts of the world it can be as valuable as gold. Especially when it's clean, potable water.
Below is a list of projects related to fields of Water Use and Water Supply
Water Use in the United States
Integrated Water Availability Assessments Fundamentals
USGS National Streamgaging Network
Next Generation Water Observing System (NGWOS)
Water-Use Terminology
Monitoring Water-Quality Changes in the Chesapeake Bay Watershed
Changes in Water Use Categories
Monitoring Water-Quality Response of Conservation Practices in the Bucks Branch Watershed, Sussex County, Delaware
Hydrogeology and Groundwater Quality of the Anacostia River Watershed
Below are some frequently asked questions sometimes heard in the fields of Water Use and Water Supply
In addition to FAQs, please refer to our glossaries
Water Basics Glossary
Hydrologic Definitions
Water Science-Glossary of Terms
Water Resources Data - Definition of Terms
Glossary of water-use terminology
A-Z Index of Hydrologic Terms
Where can I get my well water tested? Where can I get my well water tested?
Some counties offer free well water testing, so check with your county first. If they don't, use this EPA website to find a list of state-certified laboratories in your area that do water testing, or contact your county or state health department or your State Certification Officer for assistance. Prices will vary depending on the laboratory and the test(s), but most people consider the cost to be...
Where can I get real-time and historical streamflow information? Where can I get real-time and historical streamflow information?
Water Data for the Nation (WDFN) is the home for USGS streamflow, groundwater, and water quality data. Through WDFN you can find different tools to look at historic and real-time streamflow data, find sites of interest, and access using USGS water data application programming interfaces (APIs). State pages (e.g., California) allow you to discover real-time data in your state, or you can create a...
How can I find the depth to the water table in a specific location? How can I find the depth to the water table in a specific location?
The depth to the water table can change (rise or fall) depending on the time of year. During the late winter and spring when accumulated snow starts to melt and spring rainfall is plentiful, water on the surface infiltrates into the ground and the water table rises. When water-loving plants start to grow again in the spring and precipitation gives way to hot, dry summers, the water table falls...
What is the Earth's "water cycle?" What is the Earth's "water cycle?"
The water cycle, also known as the hydrologic cycle, describes where water is stored on Earth and how it moves. Water is stored in the atmosphere, on the land surface, and below the ground. It can be a liquid, a solid, or a gas. Liquid water can be fresh or saline (salty). Water moves between the places it is stored. It moves at large scales (through watersheds, the atmosphere, and below the Earth...
Where can I find information about my local drinking water supply? Where can I find information about my local drinking water supply?
The best way to learn about your local drinking water quality is to read the annual drinking water quality report/consumer confidence report that water suppliers now send out by July 1 of each year. The reports are often sent out with water bills, but they may be sent separately. The reports tell where drinking water comes from, what contaminants are in it, and at what levels. The U.S...
Does the use of pesticides affect our Nation's water quality? Does the use of pesticides affect our Nation's water quality?
Pesticide use in the United States has increased because not only must we supply our exploding population with food, but crops and food are also grown for export to other countries. The United States has become the largest producer of food products in the world, partly owing to our use of modern chemicals (pesticides) to control the insects, weeds, and other organisms that attack food crops. But...
Is saline water used for anything? Is saline water used for anything?
In the U.S., about 13 percent of all water used is saline water. But saline water can only be used for certain purposes. The main use is for thermoelectric power-plant cooling. About 5 percent of water used for industrial purposes is saline, and about 53 percent of all water used for mining purposes is saline. Saline water can be desalinated for use as drinking water by putting it through a...
Where can I find information about bottled water? Where can I find information about bottled water?
Bottled water is regulated by the U.S. Food and Drug Administration and by individual states. For general information about bottled water, sources include the International Bottled Water Association and NSF International. Learn More: Water bottling across the U.S. - interactive map Water Use - Withdrawals for Bottled Water
How much natural water is there? How much natural water is there?
Earth is estimated to hold about 1,386,000,000 cubic kilometers of water. The breakdown of where all that water resides is estimated as follows: Oceans (saline) 1,338,000,000 cubic kilometers Ice caps and glaciers (fresh) 24,064,000 cubic kilometers Groundwater (fresh and saline) 23,400,000 cubic kilometers Streams, lakes, swamps (fresh) 104,590 cubic kilometers Lakes (saline) 85,400 cubic...
Why does my drinking water look cloudy sometimes? Why does my drinking water look cloudy sometimes?
Once in a while you get a glass of water that looks cloudy; maybe milky is a better term. After a few seconds it miraculously clears up! The cloudiness is due to tiny air bubbles in the water. Like any bubbles, the air rises to the top of the water and goes into the air, clearing up the water. The water in the pipes coming into your house might be under a bit of pressure. This causes gases (air)...
How much water is used by people in the United States? How much water is used by people in the United States?
Since 1950, the USGS has collected and analyzed water-use data for the United States and its Territories. That data is revised every 5 years. As of 2015, the United States uses 322 billion gallons of water per day (Bgal/day). The three largest water-use categories were irrigation (118 Bgal/day), thermoelectric power (133 Bgal/day), and public supply (39 Bgal/day), cumulatively accounting for 90...