Where surface water runs low, groundwater supplements water supply
Water Insights: Short Education Activities to Explore the NWAA Report
National Water Availability Assessment: Key Findings
Explore the Report's top scientific findings through engaging stories, plain-language explanations, and interactive data visualizations.
Explore the Report's top scientific findings through engaging stories, plain-language explanations, and interactive data visualizations.
National Water Availability Assessment Report
Providing synthesis and interpretation of water availability in the past, present, and future
Providing synthesis and interpretation of water availability in the past, present, and future
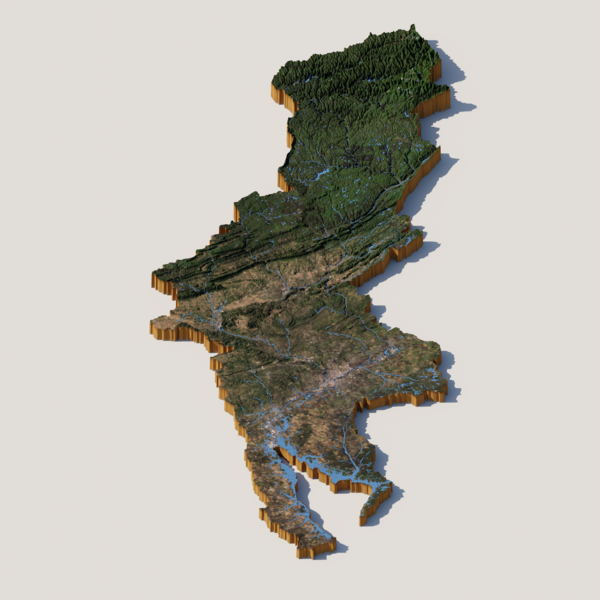
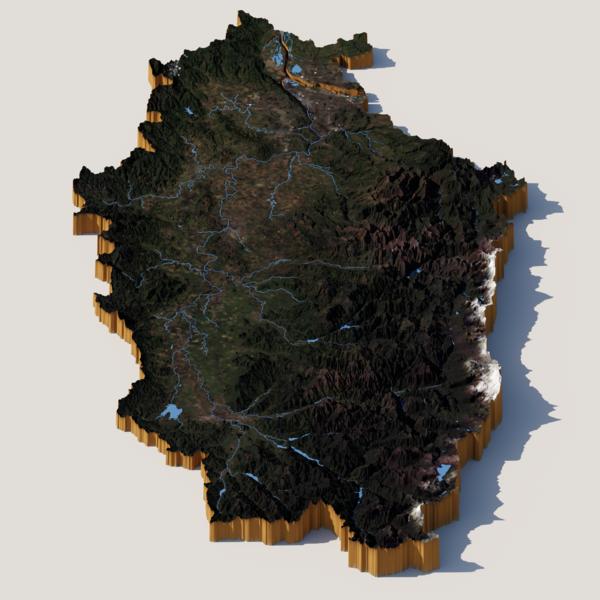
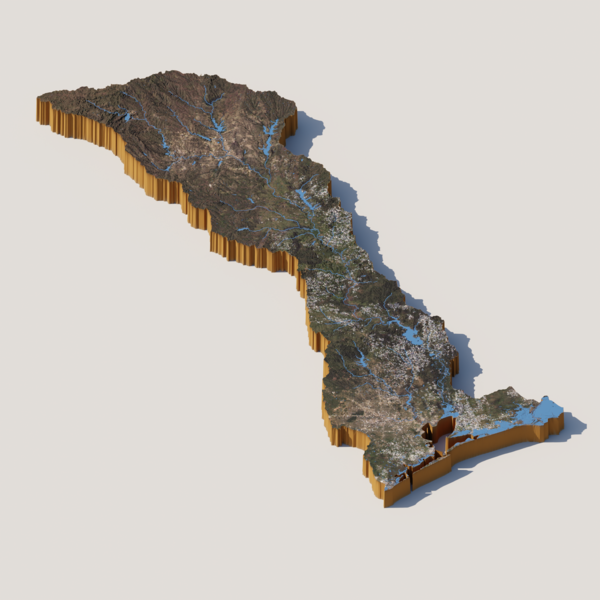
Regional Water Availability Assessments
Focused scientific assessments of water availability in different hydrologic regions across the Nation
Focused scientific assessments of water availability in different hydrologic regions across the Nation
Integrated Water Availability Assessments
The USGS Water Resources Mission Area is assessing how much water is available for human and ecological needs in the United States and identifying where and when the Nation may have challenges meeting its demand for water.


News
Where surface water runs low, groundwater supplements water supply
Where surface water runs low, groundwater supplements water supply
New Nationwide Tool Helps Answer: Do We Have Enough Water?
New Nationwide Tool Helps Answer: Do We Have Enough Water?
Elevated geogenic contaminants common in drinking water aquifers across the U.S.
Elevated geogenic contaminants common in drinking water aquifers across the U.S.
Publications
Long-term monotonic trends in water budget components in the contiguous United States: Insights from two hydrologic models Long-term monotonic trends in water budget components in the contiguous United States: Insights from two hydrologic models
Characterizing changes to water availability for domestic, industrial, agricultural, and other uses is essential to support water management. To better quantify these changes, the U.S. Geological Survey and National Science Foundation National Center for Atmospheric Research produced two hydrologic models simulating water budget components from 1980 to 2021 over the contiguous United...
Integrated water availability in the conterminous United States, 2010–20 Integrated water availability in the conterminous United States, 2010–20
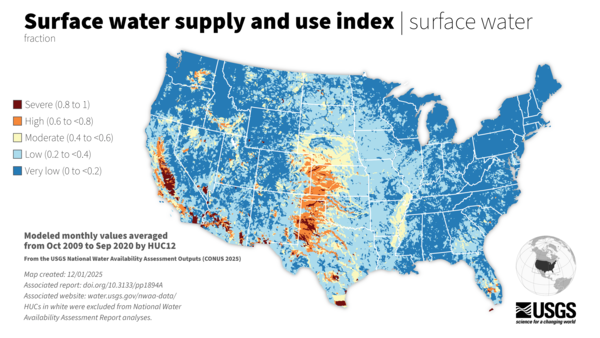
Water availability is defined as the spatial and temporal distribution of water quantity and quality as it relates to the needs of humans and ecosystems. Broad assessment of water availability requires the consideration of multiple indicators because water users have different sensitivities to the degradation of water conditions. This chapter draws upon estimates of water supply, water...
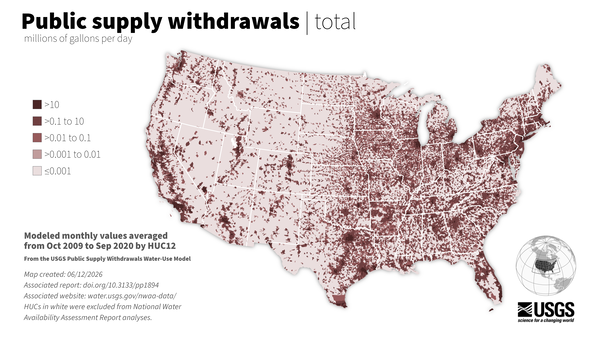
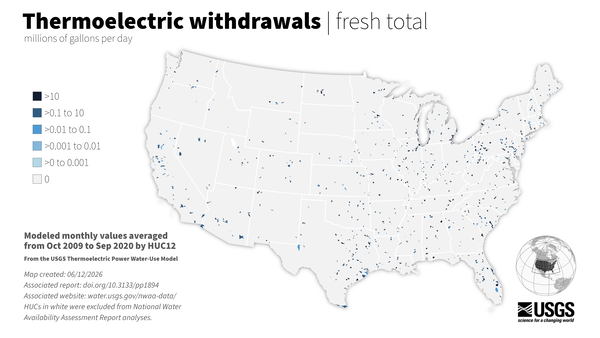
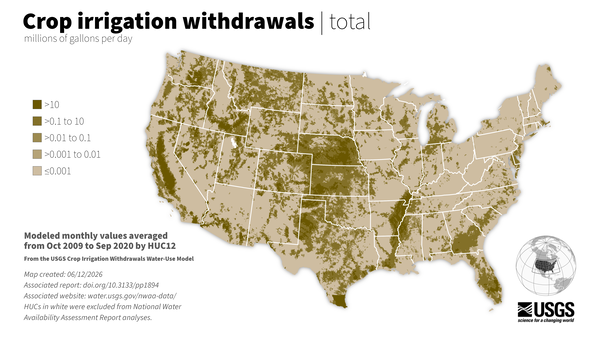
Water use across the conterminous United States, water years 2010–20 Water use across the conterminous United States, water years 2010–20
Withdrawals of water for human use are fundamental to the evaluation of the Nation’s water availability. This chapter provides an analysis of public supply, crop irrigation, and thermoelectric power water use for the conterminous United States (CONUS) during water years 2010–20. These three categories account for about 90 percent of water withdrawals in the Nation. The values presented...
Science

Accessing Water Use Data
The USGS provides historic and recent water use data for the United States including the District of Columbia, Puerto Rico, and the U.S. Virgin Islands. This page provides an up-to-date guide to accessing, downloading, and using USGS water use data.

Water Use in the United States
Since 1950, the USGS has regularly produced nationwide water‑use data, creating one of the most comprehensive pictures of how water is used across the United States. Building on this rich historical record, these data give water managers a critical foundation to evaluate long‑term trends, plan strategically, and identify and quantify water availability so they can design more adaptive, resilient...
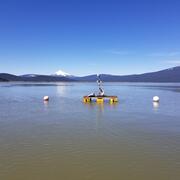
Integrating water availability in the Klamath Basin: from drought to dam removal
The USGS Water Resources Mission Area is assessing how much water is available for human and ecological needs in the United States and identifying where and when the Nation may have challenges meeting its demand for water. This information helps decision makers manage and distribute water in ways that balance competing needs. Due to its complex and competing water demands, ecological significance...