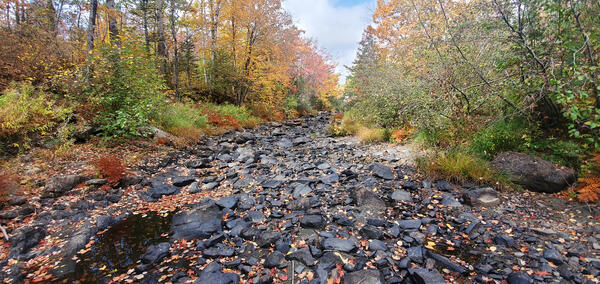
2020 drought impact on Little River near Oxford, Massachusetts
2020 drought impact on Little River near Oxford, Massachusetts2020 drought impact on Little River near the USGS station 01124500 near Oxford, Massachusetts

Official websites use .gov
A .gov website belongs to an official government organization in the United States.
Secure .gov websites use HTTPS
A lock () or https:// means you’ve safely connected to the .gov website. Share sensitive information only on official, secure websites.
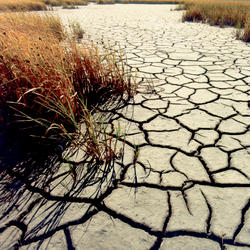
Below average and infrequent rainfall from May through September 2020 led to an extreme hydrologic drought across much of New England, with some areas experiencing a flash (quick-onset) drought.

The abrupt change in precipitation from at or above average in early May to as much as 4 in. below average in September 2020 and the resulting precipitous declines in streamflows and groundwater levels have been characterized as a flash drought (reflecting its quick onset) at some locations in New England, including northern Maine, southeastern Massachusetts, northern Rhode Island, and northeastern Connecticut. The 2020 drought rivaled other historic droughts, including those in 1995 and 1998–2002, in terms of intensity and geographic effects. Although streamflows and groundwater levels began to recover in October and November 2020, full recovery will depend on precipitation during the coming winter and spring.
Working within the constraints of strict travel restrictions, technicians and scientists collected more than 350 additional field measurements to define stage-discharge relationships and ensure accurate data for decision makers; held or attended 26 virtual meetings for drought committees to discuss hydrologic conditions with Federal, State, and local partners; and brought drought-related expertise to the public through 15 media encounters.
Please check the “2020 drought in New England” publication for more info.
Below are other science projects associated with this project.


Below are selected drought photos from New England.
2020 drought impact on Little River near the USGS station 01124500 near Oxford, Massachusetts
2020 drought impact on Little River near the USGS station 01124500 near Oxford, Massachusetts

The New England Water Science Center continuously monitors the status of New England's principal rivers, reservoirs, and aquifers to compare current hydrologic conditions with normal and extreme recorded values. Displayed on the photo is a drought impact on Cochituate Brook at Framingham, Massachusetts.
The New England Water Science Center continuously monitors the status of New England's principal rivers, reservoirs, and aquifers to compare current hydrologic conditions with normal and extreme recorded values. Displayed on the photo is a drought impact on Cochituate Brook at Framingham, Massachusetts.

Station 01184100 Stony Brook near West Suffield, Connecticut.
Station 01184100 Stony Brook near West Suffield, Connecticut.

Station 01184100 Stony Brook near West Suffield, Connecticut.
Station 01184100 Stony Brook near West Suffield, Connecticut.

Station 01196588 Mill River at Cook Hill Rd. in Cheshire, Connecticut.
Photo shows dry river channel at location of staff gage.
Station 01196588 Mill River at Cook Hill Rd. in Cheshire, Connecticut.
Photo shows dry river channel at location of staff gage.

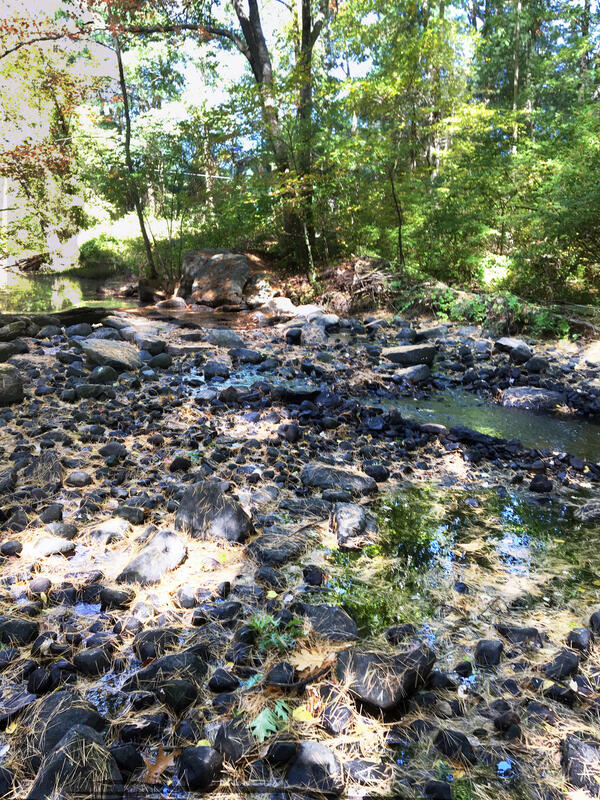
2020 drought impact on Sudbury River near the USGS station 01098530 in Saxonville, Massachusetts
2020 drought impact on Sudbury River near the USGS station 01098530 in Saxonville, Massachusetts

2020 drought impact on Segreganset River near USGS station 01109070, Dighton, Massachusetts
2020 drought impact on Segreganset River near USGS station 01109070, Dighton, Massachusetts

Quinebaug River near West Thompson, Connecticut. Photo shows one of few deeper pools of water in the 01124151 station vicinity during drought.
Quinebaug River near West Thompson, Connecticut. Photo shows one of few deeper pools of water in the 01124151 station vicinity during drought.

Station 01124151 Quinebaug River West Thompson Connecticut. The photo shows the orifice line that senses the river stage. The orifice is out of water, so we were not able to collect stage or discharge data.
Station 01124151 Quinebaug River West Thompson Connecticut. The photo shows the orifice line that senses the river stage. The orifice is out of water, so we were not able to collect stage or discharge data.
Below are FAQ associated with this project.
A drought is a period of drier-than-normal conditions that results in water-related problems. The amount of precipitation at a particular location varies from year to year, but over a period of years the average amount is fairly constant. In the deserts of the Southwest, the average precipitation is less than 3 inches per year. In contrast, the average precipitation in the Northwest is more than...

The beginning of a drought is difficult to determine. Several weeks, months, or even years might pass before people know that a drought is occurring. The end of a drought can occur as gradually as it began. The first evidence of drought is usually seen in records of rainfall. Within a short period of time, the amount of moisture in soils can begin to decrease. The effects of a drought on flow in...

To view the USGS streamflow information on drought, see the drought map on our WaterWatch site, which shows below-normal, 7-day average streamflow compared to historical streamflow for the United States. Links to additional maps and drought data are listed on the USGS Drought website and the National Integrated Drought Information System (NIDIS).

Rainfall in any form will provide some drought relief. A good analogy might be how medicine and illness relate to each other. A single dose of medicine can alleviate symptoms of illness, but it usually takes a sustained program of medication to cure an illness. Likewise, a single rainstorm will not break the drought, but it might provide temporary relief. A light to moderate shower will probably...
Below average and infrequent rainfall from May through September 2020 led to an extreme hydrologic drought across much of New England, with some areas experiencing a flash (quick-onset) drought.
The abrupt change in precipitation from at or above average in early May to as much as 4 in. below average in September 2020 and the resulting precipitous declines in streamflows and groundwater levels have been characterized as a flash drought (reflecting its quick onset) at some locations in New England, including northern Maine, southeastern Massachusetts, northern Rhode Island, and northeastern Connecticut. The 2020 drought rivaled other historic droughts, including those in 1995 and 1998–2002, in terms of intensity and geographic effects. Although streamflows and groundwater levels began to recover in October and November 2020, full recovery will depend on precipitation during the coming winter and spring.
Working within the constraints of strict travel restrictions, technicians and scientists collected more than 350 additional field measurements to define stage-discharge relationships and ensure accurate data for decision makers; held or attended 26 virtual meetings for drought committees to discuss hydrologic conditions with Federal, State, and local partners; and brought drought-related expertise to the public through 15 media encounters.
Please check the “2020 drought in New England” publication for more info.
Below are other science projects associated with this project.
Below are selected drought photos from New England.
2020 drought impact on Little River near the USGS station 01124500 near Oxford, Massachusetts
2020 drought impact on Little River near the USGS station 01124500 near Oxford, Massachusetts
The New England Water Science Center continuously monitors the status of New England's principal rivers, reservoirs, and aquifers to compare current hydrologic conditions with normal and extreme recorded values. Displayed on the photo is a drought impact on Cochituate Brook at Framingham, Massachusetts.
The New England Water Science Center continuously monitors the status of New England's principal rivers, reservoirs, and aquifers to compare current hydrologic conditions with normal and extreme recorded values. Displayed on the photo is a drought impact on Cochituate Brook at Framingham, Massachusetts.
Station 01184100 Stony Brook near West Suffield, Connecticut.
Station 01184100 Stony Brook near West Suffield, Connecticut.
Station 01184100 Stony Brook near West Suffield, Connecticut.
Station 01184100 Stony Brook near West Suffield, Connecticut.
Station 01196588 Mill River at Cook Hill Rd. in Cheshire, Connecticut.
Photo shows dry river channel at location of staff gage.
Station 01196588 Mill River at Cook Hill Rd. in Cheshire, Connecticut.
Photo shows dry river channel at location of staff gage.
2020 drought impact on Sudbury River near the USGS station 01098530 in Saxonville, Massachusetts
2020 drought impact on Sudbury River near the USGS station 01098530 in Saxonville, Massachusetts
2020 drought impact on Segreganset River near USGS station 01109070, Dighton, Massachusetts
2020 drought impact on Segreganset River near USGS station 01109070, Dighton, Massachusetts
Quinebaug River near West Thompson, Connecticut. Photo shows one of few deeper pools of water in the 01124151 station vicinity during drought.
Quinebaug River near West Thompson, Connecticut. Photo shows one of few deeper pools of water in the 01124151 station vicinity during drought.
Station 01124151 Quinebaug River West Thompson Connecticut. The photo shows the orifice line that senses the river stage. The orifice is out of water, so we were not able to collect stage or discharge data.
Station 01124151 Quinebaug River West Thompson Connecticut. The photo shows the orifice line that senses the river stage. The orifice is out of water, so we were not able to collect stage or discharge data.
Below are FAQ associated with this project.
A drought is a period of drier-than-normal conditions that results in water-related problems. The amount of precipitation at a particular location varies from year to year, but over a period of years the average amount is fairly constant. In the deserts of the Southwest, the average precipitation is less than 3 inches per year. In contrast, the average precipitation in the Northwest is more than...
The beginning of a drought is difficult to determine. Several weeks, months, or even years might pass before people know that a drought is occurring. The end of a drought can occur as gradually as it began. The first evidence of drought is usually seen in records of rainfall. Within a short period of time, the amount of moisture in soils can begin to decrease. The effects of a drought on flow in...
To view the USGS streamflow information on drought, see the drought map on our WaterWatch site, which shows below-normal, 7-day average streamflow compared to historical streamflow for the United States. Links to additional maps and drought data are listed on the USGS Drought website and the National Integrated Drought Information System (NIDIS).
Rainfall in any form will provide some drought relief. A good analogy might be how medicine and illness relate to each other. A single dose of medicine can alleviate symptoms of illness, but it usually takes a sustained program of medication to cure an illness. Likewise, a single rainstorm will not break the drought, but it might provide temporary relief. A light to moderate shower will probably...