
This diagram, released in 2022, depicts the global water cycle. It shows how human water use affects where water is stored, how it moves, and how clean it is. This diagram is available in English and Spanish.
Jennifer L Bruce
Jen Bruce is a physical scientist and communications specialist for the Integrated Information Dissemination Division of the USGS Water Resources Mission Area.
Jen spent much of her early life trying to choose between her scientific and artistic interests, and is very happy to have found a career where she can embrace both. She has degrees in graphic design, physical geography, and environmental management. Before her federal service, she worked in many private sectors including business communications, telecom research, and environmental advocacy. She is proud to contribute her diverse experience and skills to help make USGS science and information more understandable and actionable.
Jen first joined the USGS in 2003 as a publications specialist with the Wisconsin Water Science Center, and served as their outreach coordinator, web lead, cartographer, graphics and interface designer, and plain-language writer/editor. She was also the Science in the Great Lakes Mapper lead until 2019. She currently works in the Web Communications Branch of the Integrated Information Dissemination Division (IIDD) of the USGS Water Resources Mission Area (WMA). She led the WMA's Web Communications, Outreach, and Education (WebCOE) function until 2021, which included overseeing the WMA's static external web presence, social media accounts, and developing communication campaigns and products.
From 2021-2024, Jen took on a new role as the lead for the Stakeholder Engagement for Water Hazard Science and Response Project (SERP) for the WMA Water Hazards Program. The goal of this project is to identify how the WMA can best support USGS water-hazard activities before, during, and after an event. This includes understanding internal and external perceptions, needs, and organizational processes to identify opportunities to improve the consistency, alignment, and maturity of USGS water-hazard science, response, communication, and data delivery.
Jen continues to serve as a communications strategist and web content manager for the Water Mission Area as well as USGS Emergency Management and the Office of Risk & Resilience. She also co-leads the USGS Water External Communications Community of Practice (WEC) and is an administrator and storymap specialist for the USGS ArcGIS Online (AGOL) community.
Science and Products
Water Cycle Diagrams
Learn more about where water is on Earth and how it moves using one of the USGS water cycle diagrams. We offer downloadable and interactive versions of the water cycle diagram for elementary students and beyond. Our diagrams are also available in multiple languages. Explore our diagrams below.

Geographic Searches for USGS Publications (Bureau-wide Application)
The purpose of this project is to improve the USGS Publications Warehouse (Pubs Warehouse) so that a person can search for USGS publications by geographic region in addition to existing search criteria; for example, one could search using map zooms or congressional districts. The addition of geographic searches allows users to narrow their search results to specific areas of interest...

Flood Inundation Mapping (FIM) Program
Floods are the leading cause of natural-disaster losses in the U.S. More than 75 percent of declared Federal disasters are related to floods, and annual flood losses average almost $8 billion with over 90 fatalities per year. Although the amount of fatalities has declined due to improved early warning systems, economic losses continue to rise with increased urbanization in flood-hazard areas.

Geographic Searches for USGS Publications (Bureau-wide Application)
The purpose of this project is to improve the USGS Publications Warehouse (Pubs Warehouse) so that a person can search for USGS publications by geographic region in addition to existing search criteria; for example, one could search using map zooms or congressional districts. The addition of geographic searches allows users to narrow their search results to specific areas of interest...

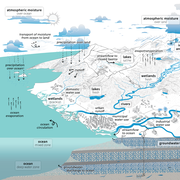
The Water Cycle (PNG)
This diagram, released in 2022, depicts the global water cycle. It shows how human water use affects where water is stored, how it moves, and how clean it is. This diagram is available in English and Spanish.
Science and Products
Water Cycle Diagrams
Learn more about where water is on Earth and how it moves using one of the USGS water cycle diagrams. We offer downloadable and interactive versions of the water cycle diagram for elementary students and beyond. Our diagrams are also available in multiple languages. Explore our diagrams below.
Geographic Searches for USGS Publications (Bureau-wide Application)
The purpose of this project is to improve the USGS Publications Warehouse (Pubs Warehouse) so that a person can search for USGS publications by geographic region in addition to existing search criteria; for example, one could search using map zooms or congressional districts. The addition of geographic searches allows users to narrow their search results to specific areas of interest...
Flood Inundation Mapping (FIM) Program
Floods are the leading cause of natural-disaster losses in the U.S. More than 75 percent of declared Federal disasters are related to floods, and annual flood losses average almost $8 billion with over 90 fatalities per year. Although the amount of fatalities has declined due to improved early warning systems, economic losses continue to rise with increased urbanization in flood-hazard areas.
Geographic Searches for USGS Publications (Bureau-wide Application)
The purpose of this project is to improve the USGS Publications Warehouse (Pubs Warehouse) so that a person can search for USGS publications by geographic region in addition to existing search criteria; for example, one could search using map zooms or congressional districts. The addition of geographic searches allows users to narrow their search results to specific areas of interest...
The Water Cycle (PNG)
This diagram, released in 2022, depicts the global water cycle. It shows how human water use affects where water is stored, how it moves, and how clean it is. This diagram is available in English and Spanish.
This diagram, released in 2022, depicts the global water cycle. It shows how human water use affects where water is stored, how it moves, and how clean it is. This diagram is available in English and Spanish.