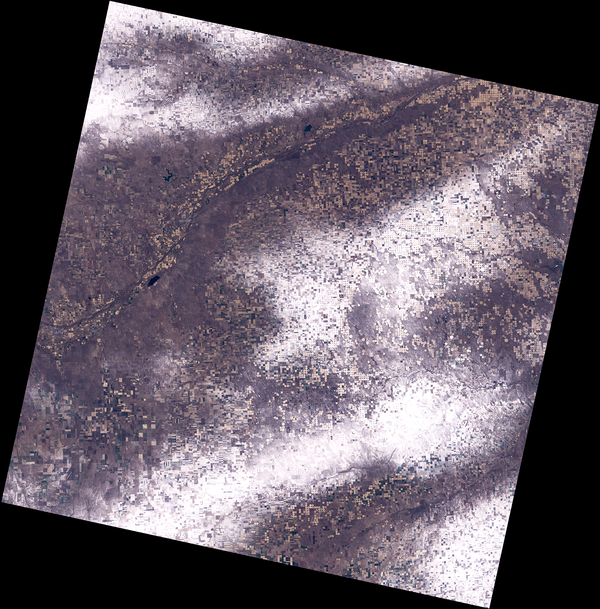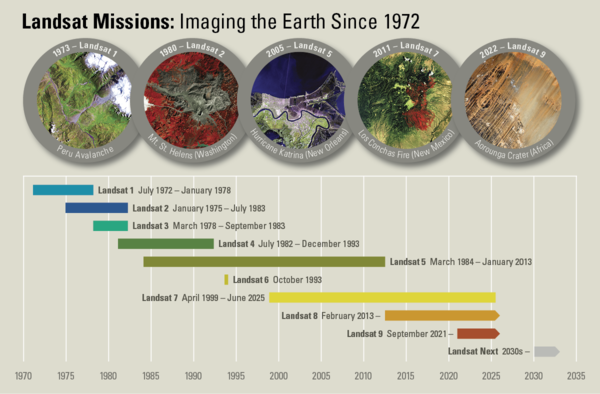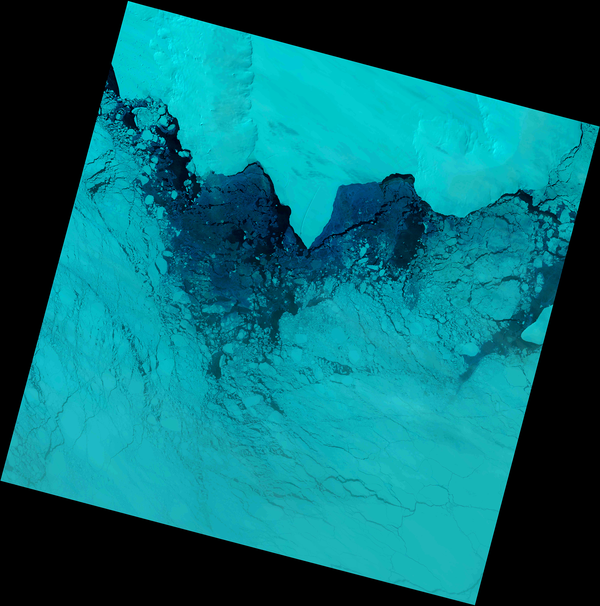
This Landsat 9 image shows ice along a portion of the Antarctic western coast and the Amundsen Sea.
This image was acquired on October 24, 2025, immediately after the Landsat 9 spacecraft recovered from a weeklong safehold event. The data used in this image were processed for the first time in March 2026.