
This graphic displays the cumulative volume of all operational Landsat products downloaded from the USGS EROS Landsat archive since December 2008 (FY2009). The release of Landsat Collection 2 products in 2020, which improved data quality and accessibility, helped drive downloads upward.
Images
Explore the images on this page to learn more about the Landsat sensors, satellites and missions.
Filter Total Items: 413
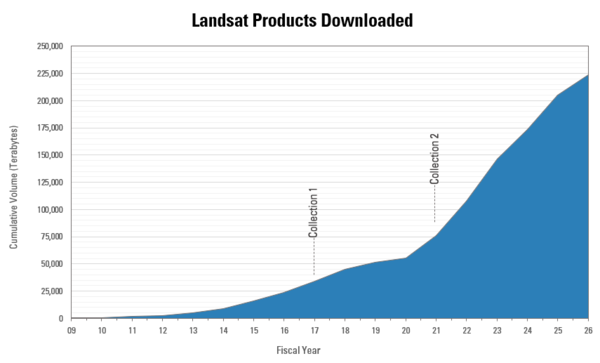
Landsat Product Downloads by Volume
This graphic displays the cumulative volume of all operational Landsat products downloaded from the USGS EROS Landsat archive since December 2008 (FY2009). The release of Landsat Collection 2 products in 2020, which improved data quality and accessibility, helped drive downloads upward.
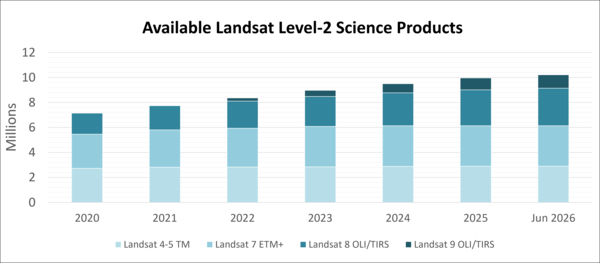
Available Landsat Level-2 Science Products
This graphic displays the number of Landsat Collection 2 Level-2 scene-based science products that are available for download from the USGS Archive. Level-2 science products were first introduced with the Collection 2 release in December, 2020. The Level-2 Science Product includes surface reflection and surface temperature data.
This graphic displays the number of Landsat Collection 2 Level-2 scene-based science products that are available for download from the USGS Archive. Level-2 science products were first introduced with the Collection 2 release in December, 2020. The Level-2 Science Product includes surface reflection and surface temperature data.
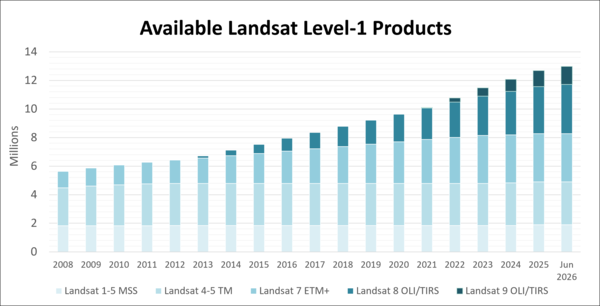
Available Landsat Level-1 Products
This graph shows the number of Landsat Collection 2 Level-1 scene-based products that are available for download from the USGS Archive. Please note that data from earlier Landsat missions, even those that have ended, continues to be added to the archive through the Landsat Global Archive Consolidation (LGAC) program.
This graph shows the number of Landsat Collection 2 Level-1 scene-based products that are available for download from the USGS Archive. Please note that data from earlier Landsat missions, even those that have ended, continues to be added to the archive through the Landsat Global Archive Consolidation (LGAC) program.
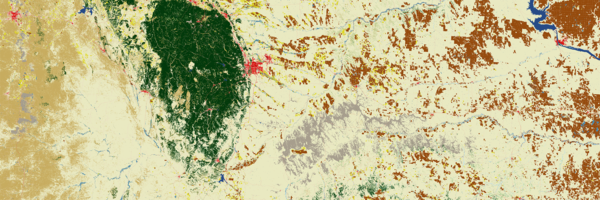
2025 Annual NLCD land cover image of western South Dakota
2025 Annual NLCD land cover image of western South DakotaThis 2025 Annual National Land Cover Database (NLCD) land cover image shows a portion of western South Dakota. The Black Hills stand out in green, and the urban area of Rapid City in red at its eastern edge. The Badlands show up as gray hues, and vast range and grasslands fill the area leading over to the Missouri River.
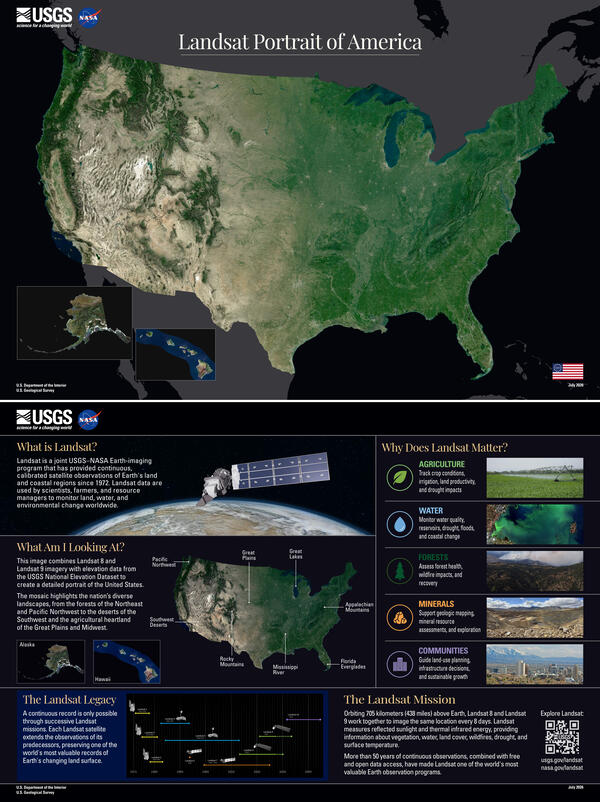
Landsat Portrait of America
The complete Landsat Portrait of America poster, shown with the front on top and the back below.
The complete Landsat Portrait of America poster, shown with the front on top and the back below.
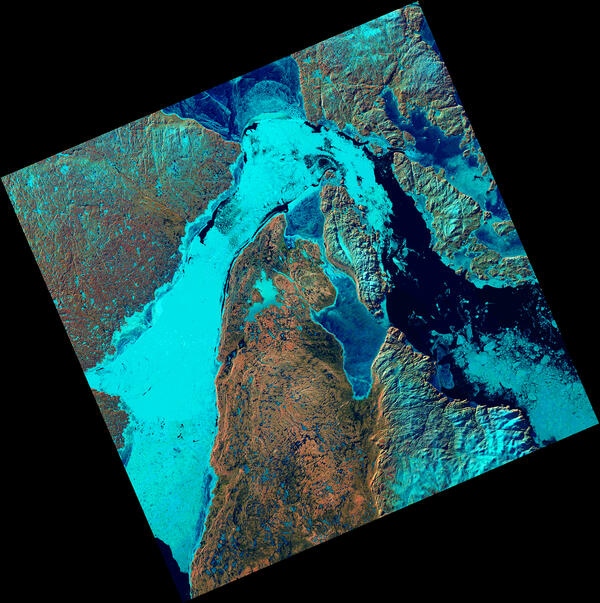
Ice Fills Roes Welcome Sound
The Landsat 8 satellite captured an image showing sea ice packed into Roes Welcome Sound, located along the northwestern edge of Southampton Island and around Qikiqtaaluk Island in the uninhabited Canadian Arctic Archipelago. East of Qikiqtaaluk, ice drifts through the Frozen Strait, extending eastward into Foxe Basin.
The Landsat 8 satellite captured an image showing sea ice packed into Roes Welcome Sound, located along the northwestern edge of Southampton Island and around Qikiqtaaluk Island in the uninhabited Canadian Arctic Archipelago. East of Qikiqtaaluk, ice drifts through the Frozen Strait, extending eastward into Foxe Basin.

Dr. Jim Irons
Dr. Jim Irons, Landsat Data Continuity Mission (LDCM) project scientist from NASA's Goddard Space Flight Center, speaks to NASA social media followers at Vandenberg Air Force Base, Calif., prior to the launch of the LDCM satellite, which was later renamed Landsat 8 after reaching orbit.
Photo credit: NASA

Dr. Eric Vermote
Dr. Eric Vermote is a research scientist with NASA. Dr. Vermote is a member of the Landsat Science Team.
Photo credit: NASA
Dr. Eric Vermote is a research scientist with NASA. Dr. Vermote is a member of the Landsat Science Team.
Photo credit: NASA
Cumulative Number of Landsat Scenes
The USGS Landsat archive holds over fifty years of Earth-Observing satellite data. This animation displays the cumulative number of Landsat scenes since 1972. The colors on the maps show the density of the number of Landsat Level-1 products.
The USGS Landsat archive holds over fifty years of Earth-Observing satellite data. This animation displays the cumulative number of Landsat scenes since 1972. The colors on the maps show the density of the number of Landsat Level-1 products.
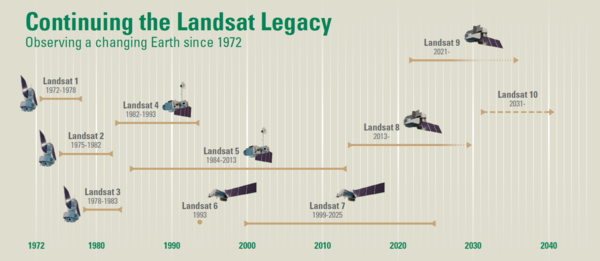
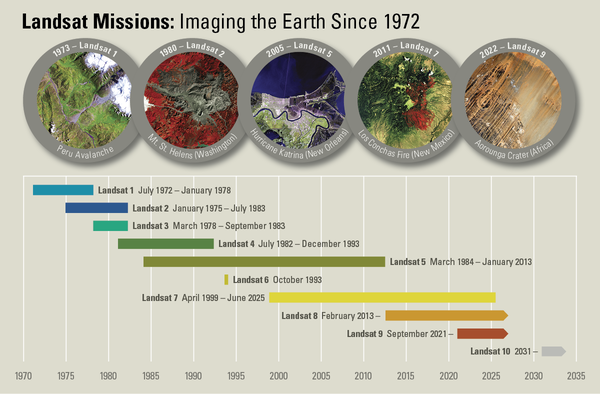
Continuing the Landsat Legacy
Timeline of the Landsat program, beginning with the launch of Landsat 1 in 1972. Landsat 10 is expected to launch in 2031. As the tenth Landsat mission, it will continue the legacy of the Landsat program.
Visit the Landsat Missions webpage to learn more.
Timeline of the Landsat program, beginning with the launch of Landsat 1 in 1972. Landsat 10 is expected to launch in 2031. As the tenth Landsat mission, it will continue the legacy of the Landsat program.
Visit the Landsat Missions webpage to learn more.
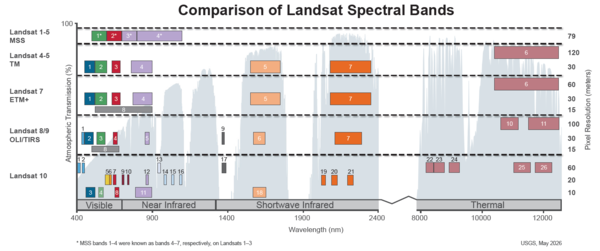
Spectral Bandpasses for all Landsat Sensors
This image shows the spectral bandpasses for the sensors on all Landsat satellites.
This image shows the spectral bandpasses for the sensors on all Landsat satellites.
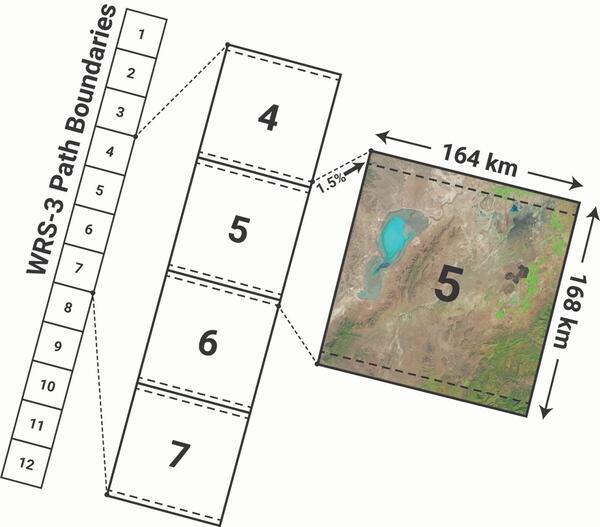
Worldwide Reference System-3 (WRS-3)
A new Worldwide Reference System, WRS-3, was developed for Landsat 10 due to the change in orbital parameters. The WRS-3 will provide a method to acquire, index, and catalog Landsat 10 scenes.
A new Worldwide Reference System, WRS-3, was developed for Landsat 10 due to the change in orbital parameters. The WRS-3 will provide a method to acquire, index, and catalog Landsat 10 scenes.
Landsat Missions Timeline
In a September 21, 1966 press release, Secretary of the Interior Stewart Udall announced that the DOI was launching "Project EROS (Earth Resources Observation Satellites)." Udall's vision was to observe the Earth for the benefit of all.
In a September 21, 1966 press release, Secretary of the Interior Stewart Udall announced that the DOI was launching "Project EROS (Earth Resources Observation Satellites)." Udall's vision was to observe the Earth for the benefit of all.
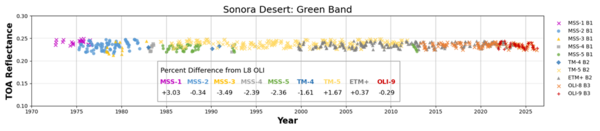
Radiometric Stability across Landsat Missions
This image displays the Top of Atmosphere(TOA) Reflectance values for the Green Band from all Landsat sensors from 1972 to present over the Sonoran Desert test site. The table shows the percent difference of the sensors’ Green Band from the established baseline Landsat 8 Operational Land Imager.
This image displays the Top of Atmosphere(TOA) Reflectance values for the Green Band from all Landsat sensors from 1972 to present over the Sonoran Desert test site. The table shows the percent difference of the sensors’ Green Band from the established baseline Landsat 8 Operational Land Imager.
Landsat Spatial Resolution Comparison
Landsat 10 will collect five foundational spectral bands at 10-meter resolution, compared to the 30-meter resolution used by Landsat 8 and 9. The smaller pixels provide sharper images and support more detailed mapping of Earth's changing landscapes. Image credit: NASA
Landsat 10 will collect five foundational spectral bands at 10-meter resolution, compared to the 30-meter resolution used by Landsat 8 and 9. The smaller pixels provide sharper images and support more detailed mapping of Earth's changing landscapes. Image credit: NASA
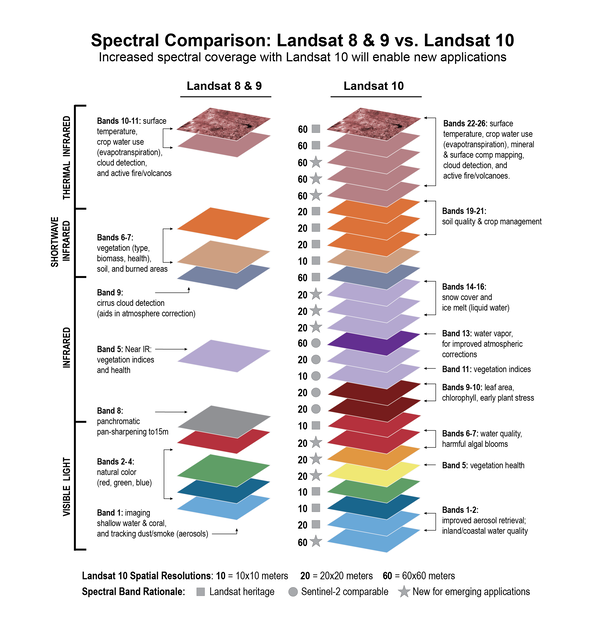
Spectral Comparison of Landsat 8-9 and Landsat 10
This illustration shows the spectral bands of the sensors onboard Landsat 8 and Landsat 9, compared to those of Landsat 10.
This illustration shows the spectral bands of the sensors onboard Landsat 8 and Landsat 9, compared to those of Landsat 10.
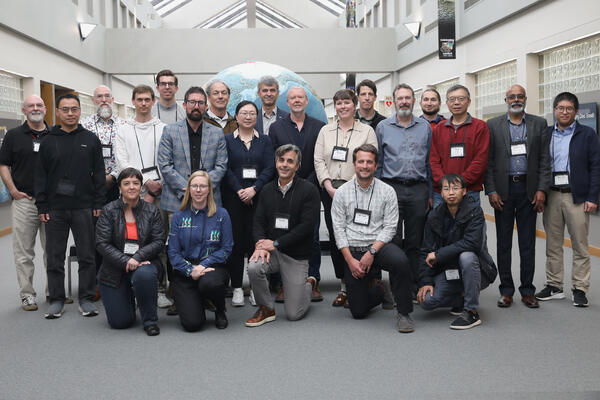
2026-2030 Landsat Science Team
The 2026-2030 Landsat Science Team met for their first in-person meeting May 5-7, 2026 at the USGS EROS Center.
The 2026-2030 Landsat Science Team met for their first in-person meeting May 5-7, 2026 at the USGS EROS Center.
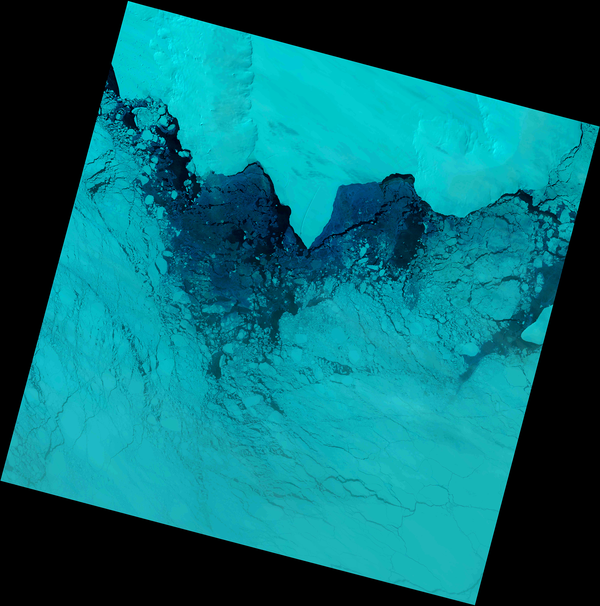
Ice Along the Western Antarctic Coastline
This Landsat 9 image shows ice along a portion of the Antarctic western coast and the Amundsen Sea.
This image was acquired on October 24, 2025, immediately after the Landsat 9 spacecraft recovered from a weeklong safehold event. The data used in this image were processed for the first time in March 2026.
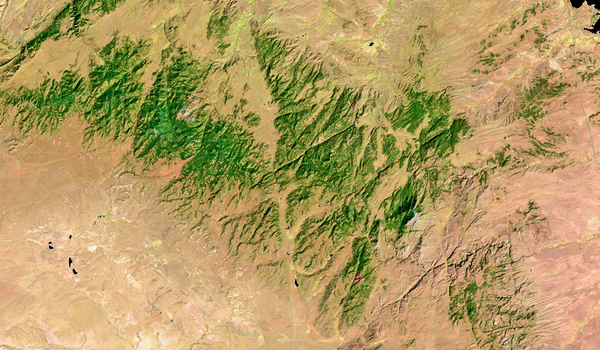
Laramie Mountains, Wyoming
This Landsat image displays a portion of the Laramie Mountains within the Medicine Bow National Forest in southeastern Wyoming. The rugged mountain range marks part of the eastern edge of the Rocky Mountains.
- Landsat 8
- Path 34 Row 31
- Acquired March 29, 2026
This Landsat image displays a portion of the Laramie Mountains within the Medicine Bow National Forest in southeastern Wyoming. The rugged mountain range marks part of the eastern edge of the Rocky Mountains.
- Landsat 8
- Path 34 Row 31
- Acquired March 29, 2026
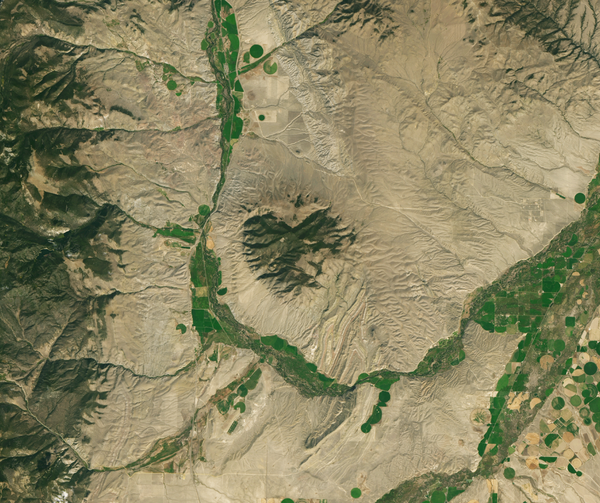
Landsat 9 Image of McCartney Mountain
Landsat 9 captured this image of heart-shaped McCartney Mountain on September 20, 2025. At an elevation of over 8,300 feet, the mountain is the high point of a small sub-range of the Highland Mountains in southwestern Montana.
Landsat 9 captured this image of heart-shaped McCartney Mountain on September 20, 2025. At an elevation of over 8,300 feet, the mountain is the high point of a small sub-range of the Highland Mountains in southwestern Montana.
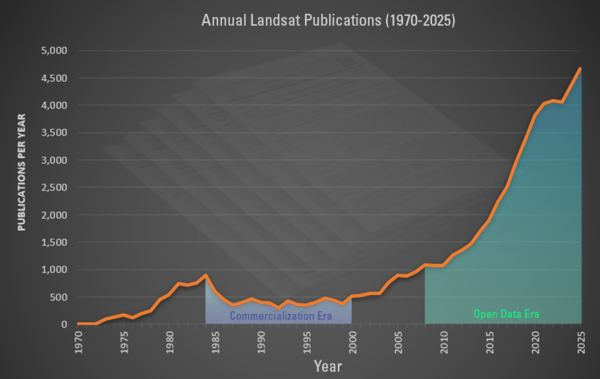
Landsat Citations
This graphic displays the number of Landsat-related publications starting in 1970. While publications decreased during the Commercialization Era, research rebounded greatly after the USGS open data policy decision in 2008.
This graphic displays the number of Landsat-related publications starting in 1970. While publications decreased during the Commercialization Era, research rebounded greatly after the USGS open data policy decision in 2008.