
A tiger swallowtail butterfly drinks nectar from a plumeless thistle flower in an abandoned agricultural field.
Images
Core Science Systems images.
Filter Total Items: 667

Zebra Swallowtail Butterfly
A tiger swallowtail butterfly drinks nectar from a plumeless thistle flower in an abandoned agricultural field.

Zebra Swallowtail Butterfly
A zebra swallowtail butterfly drinks nectar from a plumeless thistle flower in an abandoned agricultural field.
A zebra swallowtail butterfly drinks nectar from a plumeless thistle flower in an abandoned agricultural field.

Female Eastern tiger swallowtail butterfly on a plumeless thistle flower
Female Eastern tiger swallowtail butterfly on a plumeless thistle flowerA tiger swallowtail butterfly drinks nectar from a plumeless thistle flower in an abandoned agricultural field. This is the yellow form of the female Eastern tiger swallowtail. Females have blue scales on the lower hind wing.

Monarch butterfly on a plumeless thistle flower
A monarch butterfly drinks nectar from a plumeless thistle flower in an abandoned agricultural field.
A monarch butterfly drinks nectar from a plumeless thistle flower in an abandoned agricultural field.

Female Eastern Tiger Swallowtail Butterfly
An Eastern tiger swallowtail butterfly (female, black form) drinks nectar from a plumeless thistle flower in an abandoned agricultural field. Females have blue scales on the upper side of the lower hindwing.
An Eastern tiger swallowtail butterfly (female, black form) drinks nectar from a plumeless thistle flower in an abandoned agricultural field. Females have blue scales on the upper side of the lower hindwing.

Great spangled fritillary (Speyeria cybele) on a backpack strap
Great spangled fritillary (Speyeria cybele) on a backpack strapAn adult great spangled fritillary butterfly rests on the strap of a backpack left in the sun at a field research station. It may have been attracted to the radiant heat or salts left behind on the strap in human sweat.

Great spangled fritillary (Speyeria cybele) on the arm of a chair
Great spangled fritillary (Speyeria cybele) on the arm of a chairAn adult great spangled fritillary butterfly rests on the arm of a chair at a field research station.
Great spangled fritillary (Speyeria cybele) on the arm of a chair
Great spangled fritillary (Speyeria cybele) on the arm of a chairAn adult great spangled fritillary butterfly rests on the arm of a chair at a field research station.

Butterfly Specimen Souveniors
Pinned butterfly specimens sold as souveniors in a market.
Pinned butterfly specimens sold as souveniors in a market.

Butterfly and Spider Specimen Souveniors
Pinned butterfly specimens and a spider sold as souveniors in a market.
Pinned butterfly specimens and a spider sold as souveniors in a market.

Butterfly and Spider Specimen Souveniors
Pinned butterfly specimens and a spider sold as souveniors in a market.
Pinned butterfly specimens and a spider sold as souveniors in a market.

Butterfly and spider specimen souveniors
Pinned butterfly specimens and a spider sold as souveniors in a market.
Pinned butterfly specimens and a spider sold as souveniors in a market.

Butterfly specimen souveniors
Pinned butterfly specimens sold as souveniors in a market.
Pinned butterfly specimens sold as souveniors in a market.

Butterfly and spider specimen souveniors
Pinned butterfly specimens and a spider sold as souveniors in a market.
Pinned butterfly specimens and a spider sold as souveniors in a market.

Lidar pulse vs lidar return
Graphical illustration of lidar pulse versus a lidar return
Graphical illustration of lidar pulse versus a lidar return

Landsat 7 image showing the area near Ciudad Obregón, Mexico
Landsat 7 image showing the area near Ciudad Obregón, MexicoExample of the Landsat 7 ETM+ Collection 2 level-1 product. This Landsat 7 image was acquired on January 1, 2003 near Ciudad Obregón, Mexico and is shown as a natural color composite using the red, green, and blue bands (bands 3,2,1).

New York Landsat State Mosaic
New York’s Adirondack Park is the largest publicly-protected area in the conterminous United States, greater in size than Yellowstone, Everglades, Glacier, and Grand Canyon National Parks combined.
Capital Albany
Image Source Landsat 8
Population 20,201,249
New York’s Adirondack Park is the largest publicly-protected area in the conterminous United States, greater in size than Yellowstone, Everglades, Glacier, and Grand Canyon National Parks combined.
Capital Albany
Image Source Landsat 8
Population 20,201,249

Fortress Mountain Formation, Brooks Range
View southward from Fortress Mountain Formation on Atigun syncline towards Brooks Range. Trans-Alaska Pipeline, haul road, and Galbraith Lake in valley. Location in Brooks Range foothills, about 90 miles southeast of Umiat.
View southward from Fortress Mountain Formation on Atigun syncline towards Brooks Range. Trans-Alaska Pipeline, haul road, and Galbraith Lake in valley. Location in Brooks Range foothills, about 90 miles southeast of Umiat.

Path of 2001 Siren, Wisconsin, tornado on a Landsat 7 image
Path of 2001 Siren, Wisconsin, tornado on a Landsat 7 imageThis labeled Landsat 7 image from June 19, 2001, shows the path of damage caused by a June 18, 2001, tornado that passed near Siren, Wisconsin.
Path of 2001 Siren, Wisconsin, tornado on a Landsat 7 image
Path of 2001 Siren, Wisconsin, tornado on a Landsat 7 imageThis labeled Landsat 7 image from June 19, 2001, shows the path of damage caused by a June 18, 2001, tornado that passed near Siren, Wisconsin.
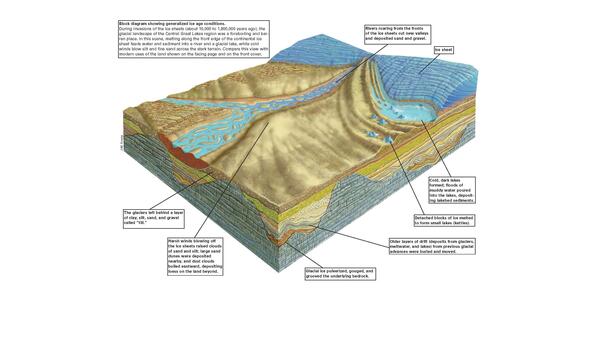
Central Great Lakes Geologic Mapping Coalition (1999): USGS Circular 1190 glacial block diagram showing generalized ice age conditions
Central Great Lakes Geologic Mapping Coalition (1999): USGS Circular 1190 glacial block diagram showing generalized ice age conditionsDuring invasions of the ice sheets (about 10,000 to 1,800,000 years ago), the glacial landscape of the Central Great Lakes region was a foreboding and barren place. In this scene, melting along the front edge of the continental ice sheet feeds water and sediment into a river and glacial lake.

Terra Model (1999)
NASA launched the Terra satellite in the Earth Observing System series containing MODIS and ASTER instruments in 1999. Data from the instruments is stored at and distributed from the LP DAAC, and EROS scientists use the data in a variety of projects.
NASA launched the Terra satellite in the Earth Observing System series containing MODIS and ASTER instruments in 1999. Data from the instruments is stored at and distributed from the LP DAAC, and EROS scientists use the data in a variety of projects.
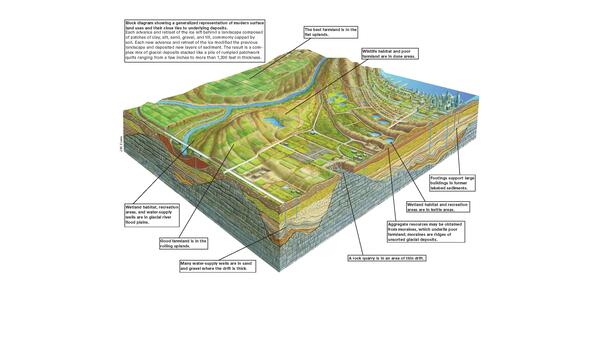
Central Great Lakes Geologic Mapping Coalition (1999): USGS Circular 1190 block diagram showing a generalized representation of modern surface land uses and their close ties to underlying deposits.
Central Great Lakes Geologic Mapping Coalition (1999): USGS Circular 1190 block diagram showing a generalized representation of modern surface land uses and their close ties to underlying deposits.Each advance and retreat of the ice sheet left behind a landscape composed of patches of clay, silt, sand, gravel and till, commonly capped by soil. This block diagram provides an artistic depiction of a modern landscape on glacial deposits.
Central Great Lakes Geologic Mapping Coalition (1999): USGS Circular 1190 block diagram showing a generalized representation of modern surface land uses and their close ties to underlying deposits.
Central Great Lakes Geologic Mapping Coalition (1999): USGS Circular 1190 block diagram showing a generalized representation of modern surface land uses and their close ties to underlying deposits.Central Great Lakes Geologic Mapping Coalition (1999): USGS Circular 1190 block diagram showing a generalized representation of modern surface land uses and their close ties to underlying deposits.
Central Great Lakes Geologic Mapping Coalition (1999): USGS Circular 1190 block diagram showing a generalized representation of modern surface land uses and their close ties to underlying deposits.Each advance and retreat of the ice sheet left behind a landscape composed of patches of clay, silt, sand, gravel and till, commonly capped by soil. This block diagram provides an artistic depiction of a modern landscape on glacial deposits.