Vintage-style poster of the Colorado River with a USGS water quality monitor portrayed on pulleys across the canyon. Poster created for WMA Great American Waterways Campaign.
Illustration by Althea A. Archer, USGS


Official websites use .gov
A .gov website belongs to an official government organization in the United States.

Secure .gov websites use HTTPS
A lock () or https:// means you’ve safely connected to the .gov website. Share sensitive information only on official, secure websites.

Explore water-related photography, imagery, and illustrations.
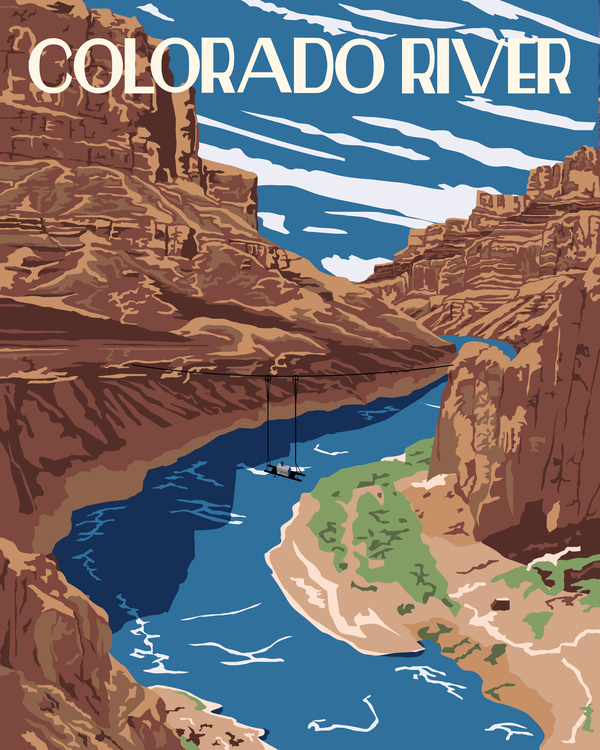
Vintage-style poster of the Colorado River with a USGS water quality monitor portrayed on pulleys across the canyon. Poster created for WMA Great American Waterways Campaign.
Illustration by Althea A. Archer, USGS
Vintage-style poster of the Colorado River with a USGS water quality monitor portrayed on pulleys across the canyon. Poster created for WMA Great American Waterways Campaign.
Illustration by Althea A. Archer, USGS
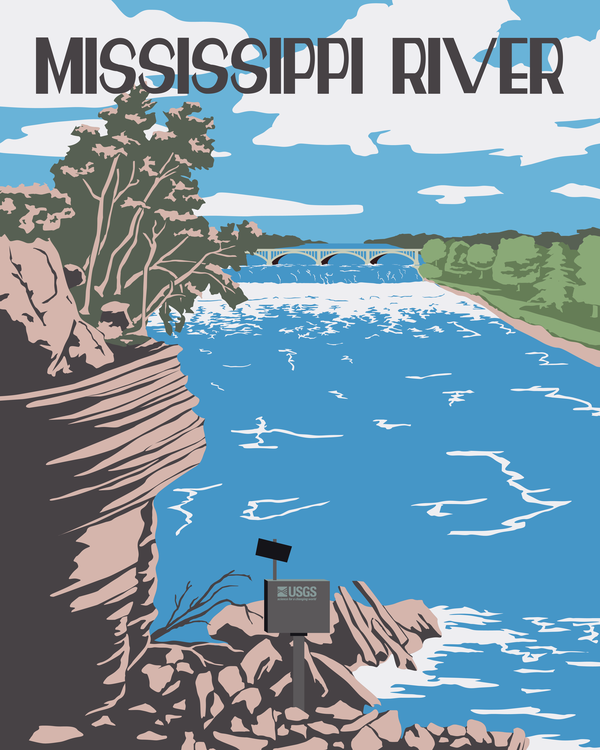
Vintage-style poster of St. Anthony Falls on the Mississippi River showing a streamgage in the foreground. Illustration by Althea A. Archer, USGS. Poster created for WMA Great American Waterways Campaign.
Illustration by Althea A. Archer, USGS
Vintage-style poster of St. Anthony Falls on the Mississippi River showing a streamgage in the foreground. Illustration by Althea A. Archer, USGS. Poster created for WMA Great American Waterways Campaign.
Illustration by Althea A. Archer, USGS
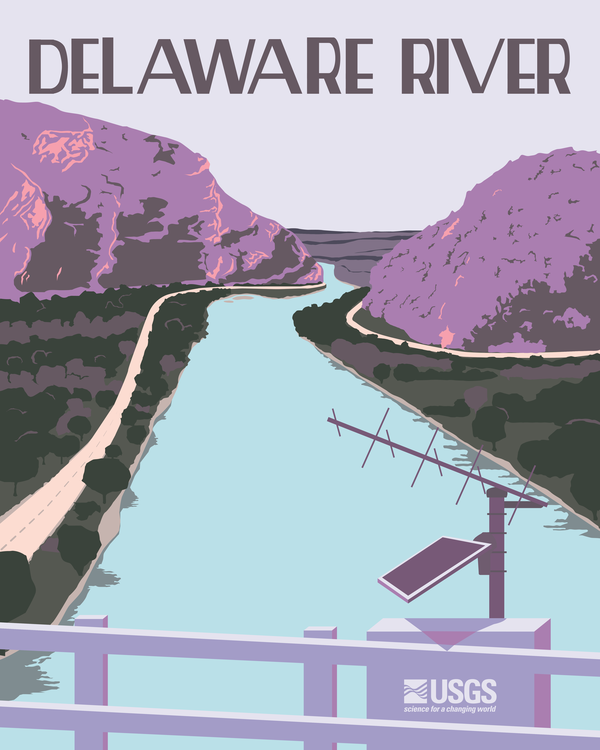
Vintage-style poster of the Delaware River near the Delaware Water Gap with a USGS gage on the bridge in the foreground. Poster created for WMA Great American Waterways Campaign.
Illustration by Althea A. Archer, USGS
Vintage-style poster of the Delaware River near the Delaware Water Gap with a USGS gage on the bridge in the foreground. Poster created for WMA Great American Waterways Campaign.
Illustration by Althea A. Archer, USGS
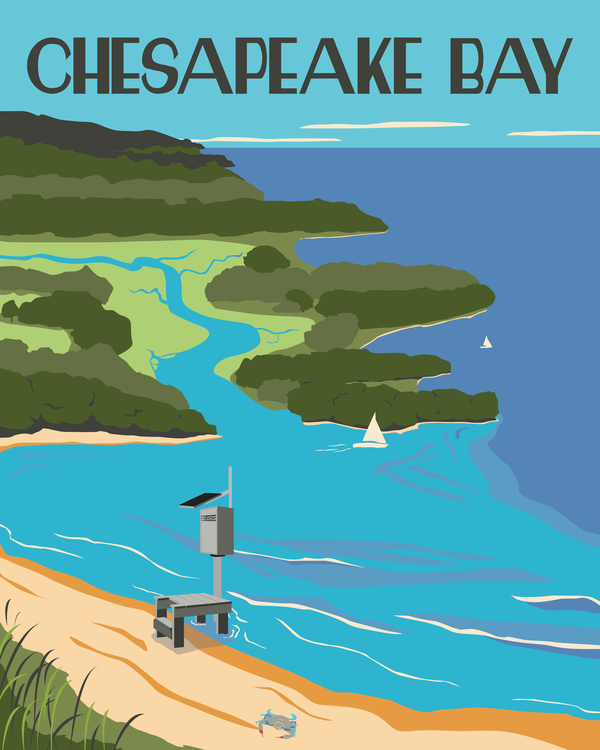
Vintage-style poster of Chesapeake Bay with a USGS gage and blue crab on the shoreline in the foreground and estuaries feeding the bay the background. Illustration by Althea A. Archer, USGS Poster created for WMA Great American Waterways Campaign.
Illustration by Althea A. Archer, USGS
Vintage-style poster of Chesapeake Bay with a USGS gage and blue crab on the shoreline in the foreground and estuaries feeding the bay the background. Illustration by Althea A. Archer, USGS Poster created for WMA Great American Waterways Campaign.
Illustration by Althea A. Archer, USGS
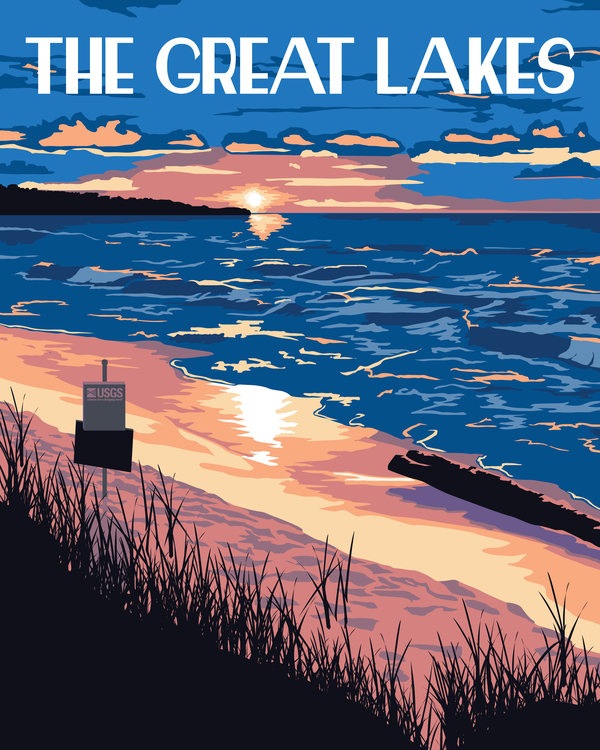
Vintage-style poster of a Great Lake during sunset with a USGS streamgage in the foreground on the shore. Poster created for WMA Great American Waterways Campaign.
Illustration by Althea A. Archer, USGS
Vintage-style poster of a Great Lake during sunset with a USGS streamgage in the foreground on the shore. Poster created for WMA Great American Waterways Campaign.
Illustration by Althea A. Archer, USGS
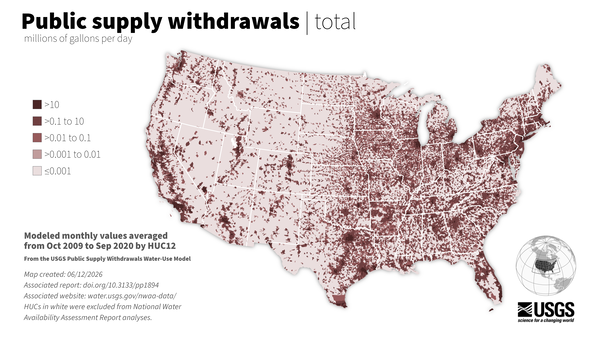
This model computes the amount of water withdrawn for public supply each month over the period from 2000 to 2020 for all subwatersheds (12-digit Hydrologic Unit Codes or HUC12s) in the conterminous United States (CONUS).
This model computes the amount of water withdrawn for public supply each month over the period from 2000 to 2020 for all subwatersheds (12-digit Hydrologic Unit Codes or HUC12s) in the conterminous United States (CONUS).
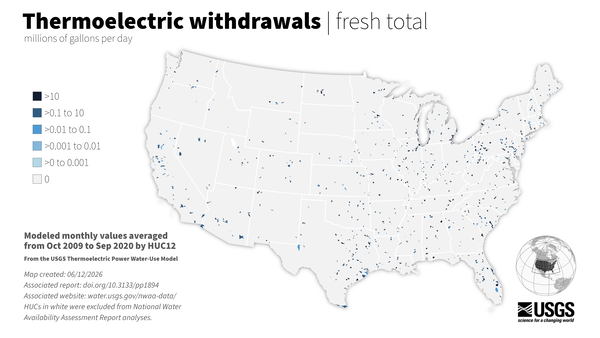
This model computes the amount of water withdrawn and consumed by thermoelectric power plants each month over the period from 2008 to 2020 for all subwatersheds (12-digit Hydrologic Unit Codes or HUC12s) in the conterminous United Sta
This model computes the amount of water withdrawn and consumed by thermoelectric power plants each month over the period from 2008 to 2020 for all subwatersheds (12-digit Hydrologic Unit Codes or HUC12s) in the conterminous United Sta
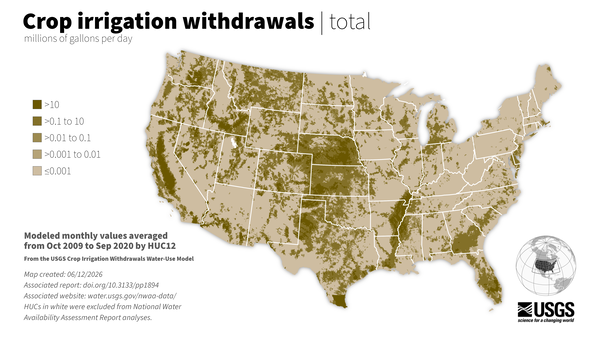
This model computes the amount of crop irrigation withdrawals each month over the period from 2000 to 2020 for all subwatersheds (12-digit Hydrologic Unit Codes or HUC12s) in the conterminous United States (CONUS).
This model computes the amount of crop irrigation withdrawals each month over the period from 2000 to 2020 for all subwatersheds (12-digit Hydrologic Unit Codes or HUC12s) in the conterminous United States (CONUS).
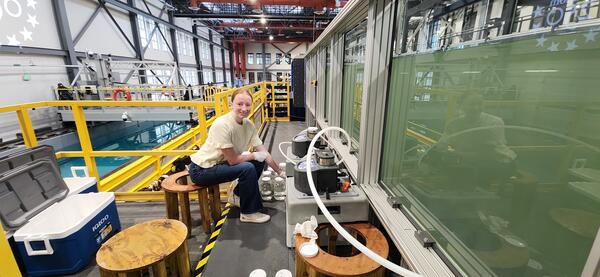
Heather Hutchcraft, a University of Alabama engineering student, receiving hands-on training at the HIF with the BLZZRD water sampling system through a collaborative USGS and University of Maryland research partnership.
Heather Hutchcraft, a University of Alabama engineering student, receiving hands-on training at the HIF with the BLZZRD water sampling system through a collaborative USGS and University of Maryland research partnership.
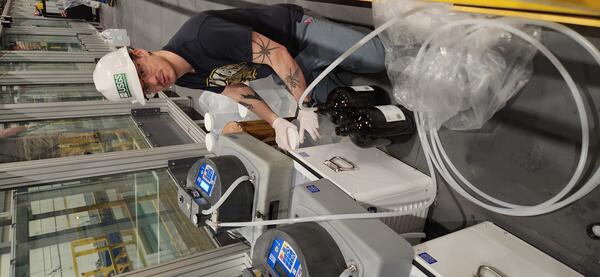
Tyler Bowser, Physical Scientist with the USGS Maryland-Delaware-D.C. Water Science Center, collecting water samples during 6PPD-quinone (6PPD-Q) transport experiments in the HIF tilting flume.
Tyler Bowser, Physical Scientist with the USGS Maryland-Delaware-D.C. Water Science Center, collecting water samples during 6PPD-quinone (6PPD-Q) transport experiments in the HIF tilting flume.
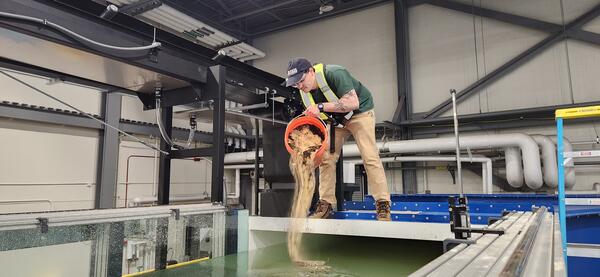
Tyler Bowser, Physical Scientist with the USGS Maryland-Delaware-D.C. Water Science Center, introducing sediment into the HIF tilting flume to establish controlled sediment transport conditions for laboratory experimentation.
Tyler Bowser, Physical Scientist with the USGS Maryland-Delaware-D.C. Water Science Center, introducing sediment into the HIF tilting flume to establish controlled sediment transport conditions for laboratory experimentation.
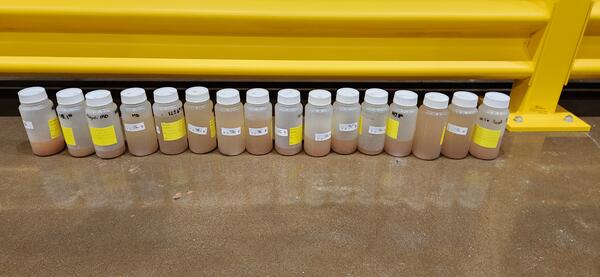
Sample bottles containing suspended sediment collected during tilting flume experiments at the Hydrologic Instrumentation Facility (HIF).
Sample bottles containing suspended sediment collected during tilting flume experiments at the Hydrologic Instrumentation Facility (HIF).
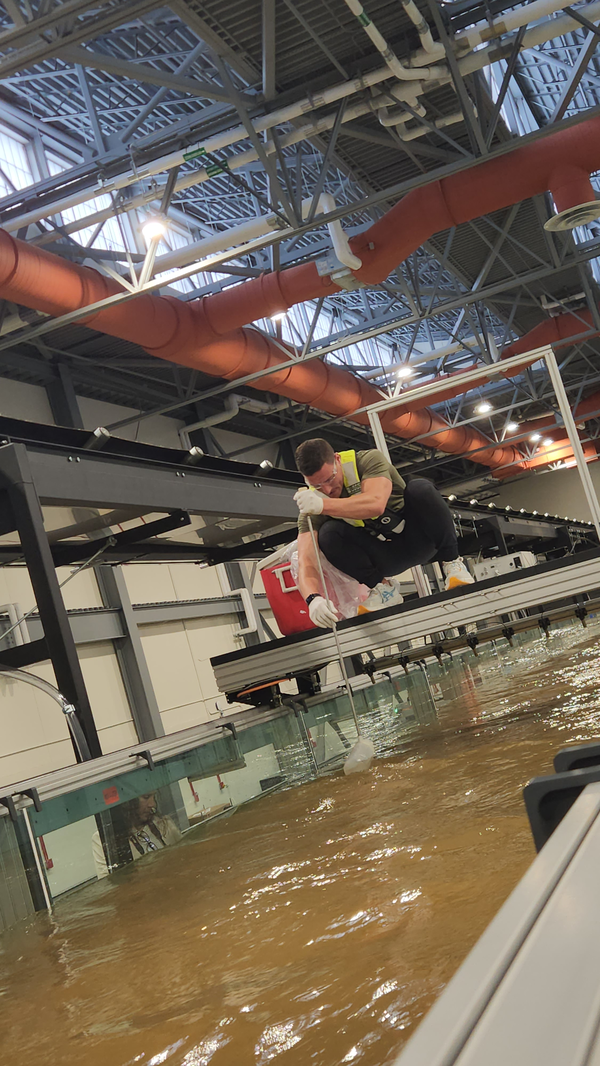
Jeremy Malen, Hydrologic Technician with the USGS Maryland-Delaware-D.C. Water Science Center, applying his field sampling expertise to laboratory experiments aboard the HIF tilting flume carriage.
Jeremy Malen, Hydrologic Technician with the USGS Maryland-Delaware-D.C. Water Science Center, applying his field sampling expertise to laboratory experiments aboard the HIF tilting flume carriage.
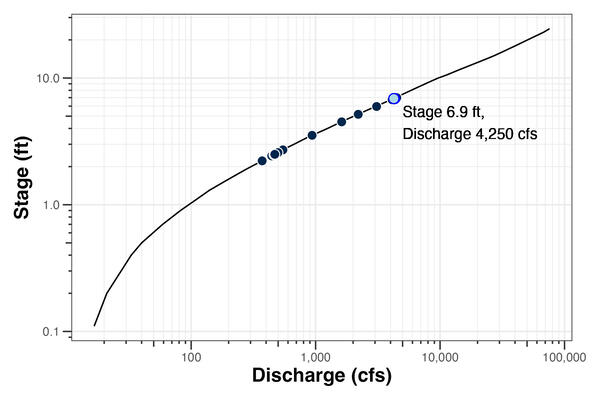
USGS Stage-Discharge Relation Example.
USGS Stage-Discharge Relation Example.
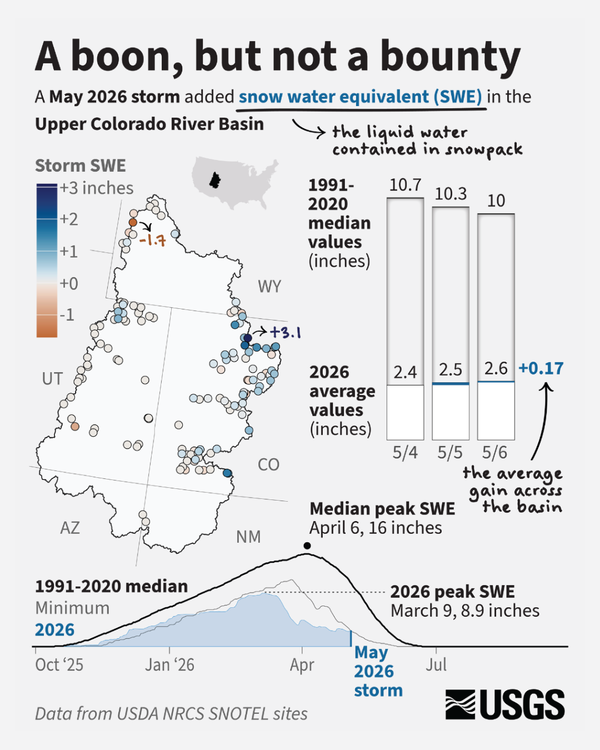
May 2026 snowstorm in the Colorado River Basin. This infographic includes data visualizations showing the impact of the snowstorm on snow water equivalent across the basin.
May 2026 snowstorm in the Colorado River Basin. This infographic includes data visualizations showing the impact of the snowstorm on snow water equivalent across the basin.
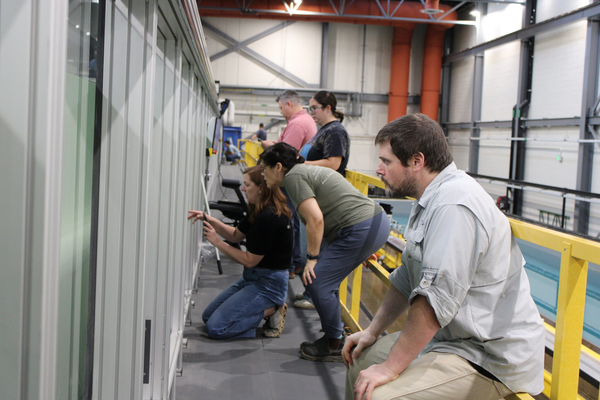
HIF Engineer AJ Stokes closely monitors the tilting flume during an experiment at the HIF, ensuring conditions are maintained throughout the research activity alongside the project team members from University of Alabama (Lisa Davis and Emily Elliott; Department of Geography & the Environment).
HIF Engineer AJ Stokes closely monitors the tilting flume during an experiment at the HIF, ensuring conditions are maintained throughout the research activity alongside the project team members from University of Alabama (Lisa Davis and Emily Elliott; Department of Geography & the Environment).

Image for the USGS Colorado River Basin Actionable and Strategic Integrated Science and Technology (ASIST) Initiative, geonarrative about the intersection of water use for copper mining and historic drought in the Lower Colorado River Basin (primarily Arizona), April 7, 2026.
Image for the USGS Colorado River Basin Actionable and Strategic Integrated Science and Technology (ASIST) Initiative, geonarrative about the intersection of water use for copper mining and historic drought in the Lower Colorado River Basin (primarily Arizona), April 7, 2026.
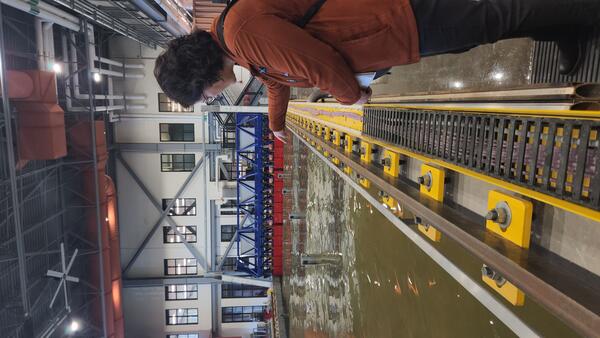
Dr. Lisa Davis, Associate Professor in the University of Alabama Department of Geography and the Environment, discussing future collaborative research opportunities at the HIF test basin wave generator with the HIF R&D Technical Director.
Dr. Lisa Davis, Associate Professor in the University of Alabama Department of Geography and the Environment, discussing future collaborative research opportunities at the HIF test basin wave generator with the HIF R&D Technical Director.
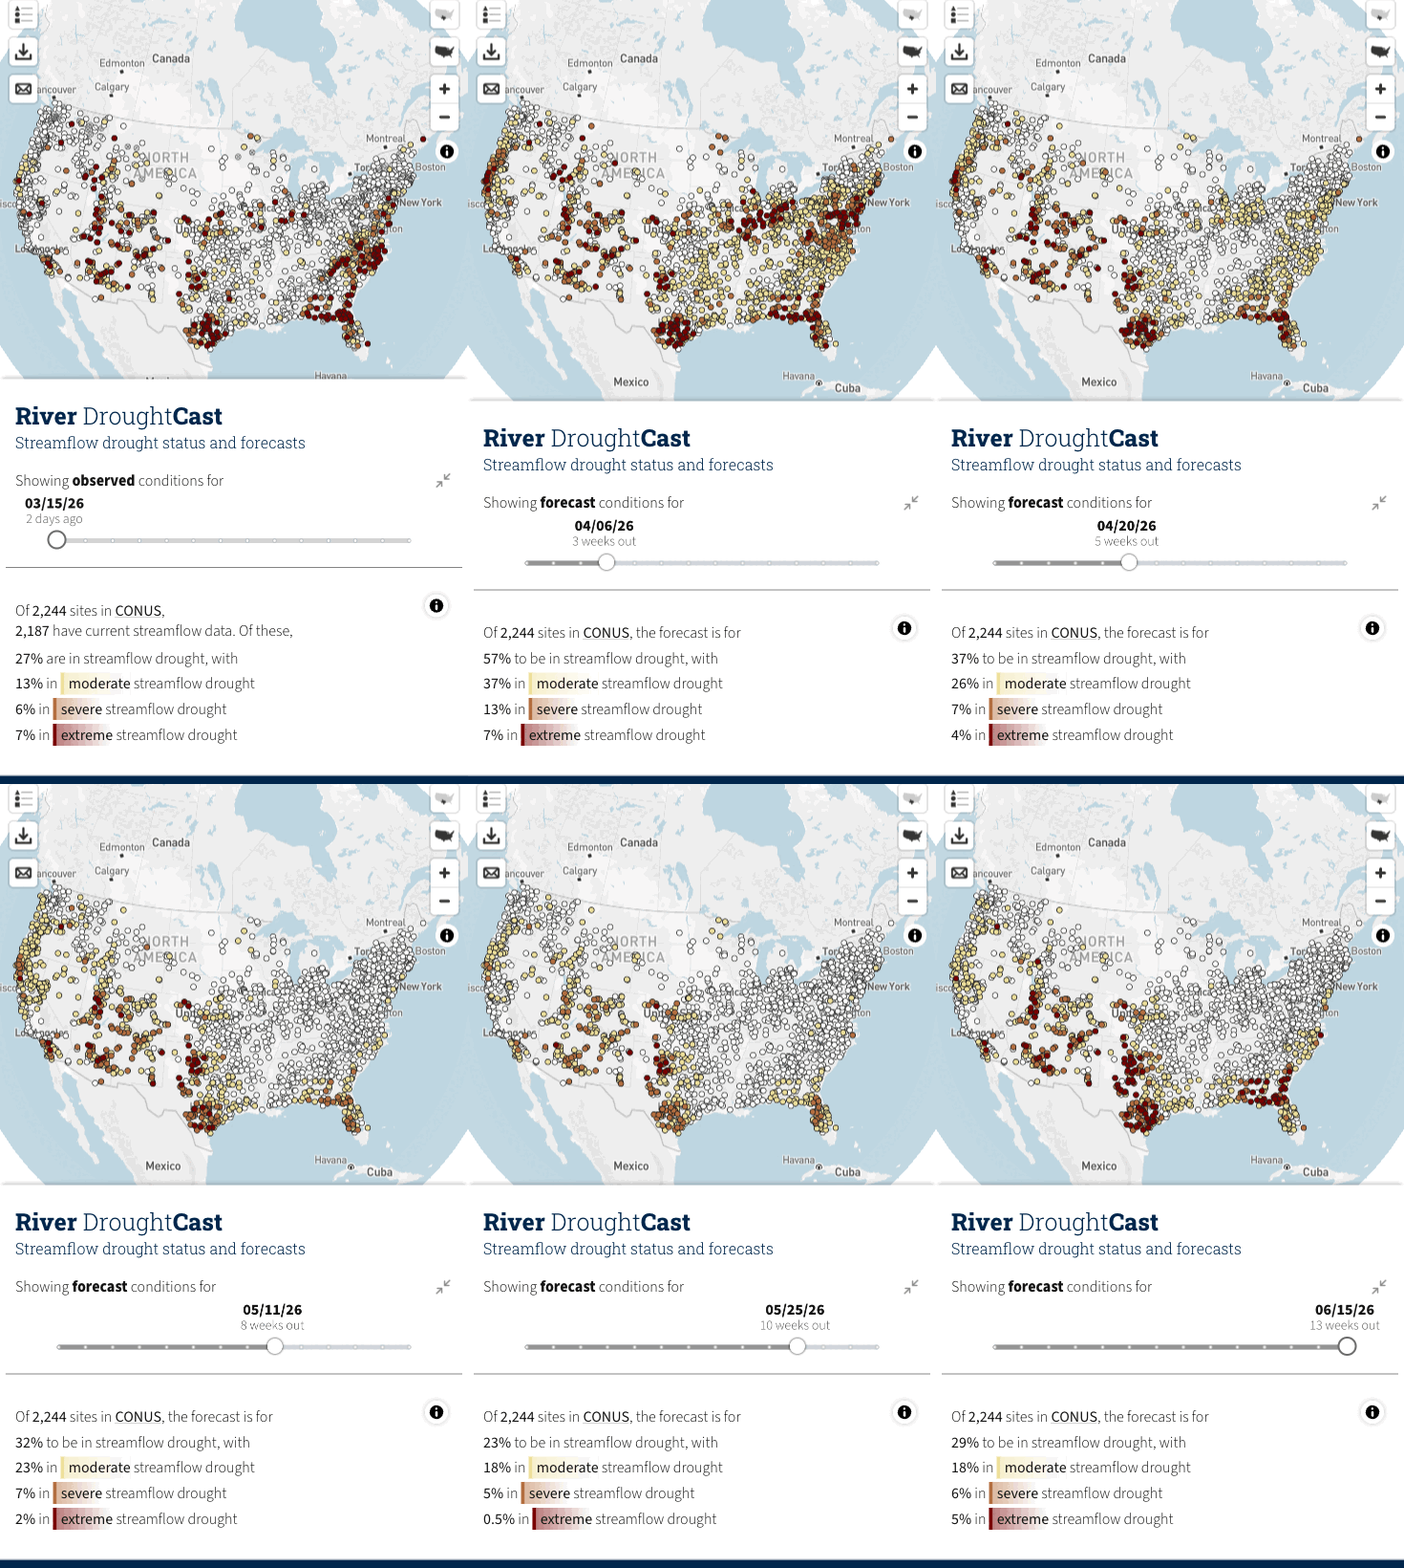
River DroughtCast is a new machine learning system that predicts streamflow droughts — specifically “streamflow” droughts when rivers and streams drop to unusually low levels— up to 90 days in advance. Each prediction comes with uncertainty information to help users understand the confidence level of the forecast.
River DroughtCast is a new machine learning system that predicts streamflow droughts — specifically “streamflow” droughts when rivers and streams drop to unusually low levels— up to 90 days in advance. Each prediction comes with uncertainty information to help users understand the confidence level of the forecast.

Diagram of a typical streamgage installation with equipment used to measure stream stage
Diagram of a typical streamgage installation with equipment used to measure stream stage

Diagram of how USGS water data are transferred from streamgage to the internet
Diagram of how USGS water data are transferred from streamgage to the internet