



The USGS Water Resources Mission Area develops state-of-the-art remote sensing and satellite technology to monitor water quality across the United States. Remote sensing allows us to track water quality conditions and monitor potentially hazardous events like harmful algal blooms in every lake and river in the country that is 100 m or more in width.
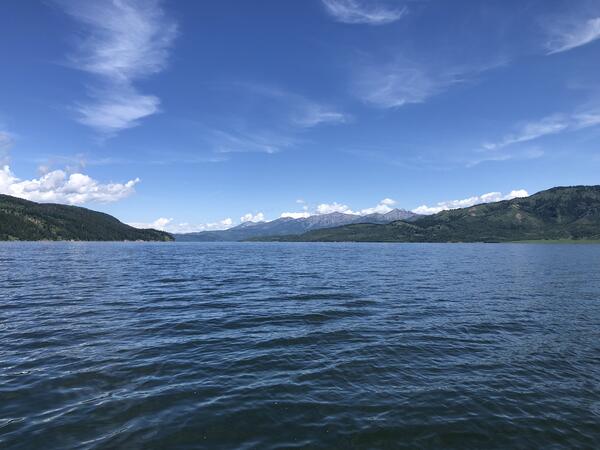
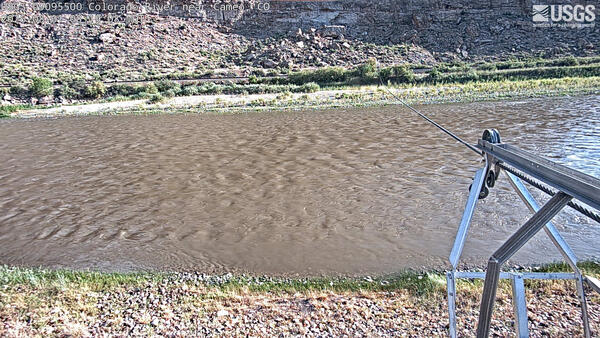
What is in the water impacts its appearance. The color of water varies because of how light, water, and substances in the water interact. Clear water has a different color than water laden with sediment (which is often brown), which has a different color than water with a high concentration of algae (which is often green).

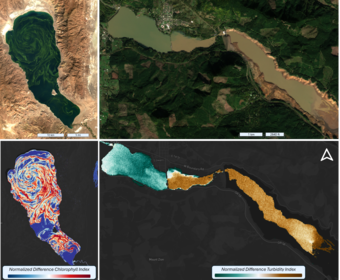
Measuring the color of water allows us to identify water quality. Lots of red light? Likely high in sediment. Lots of green and near-infrared light? Likely high in aquatic chlorophyll, and algae indicator. Models that categorize the color of water can be used to assign waterbody trophic state and to map water quality categories within and among waterbodies.
Leaders in the field
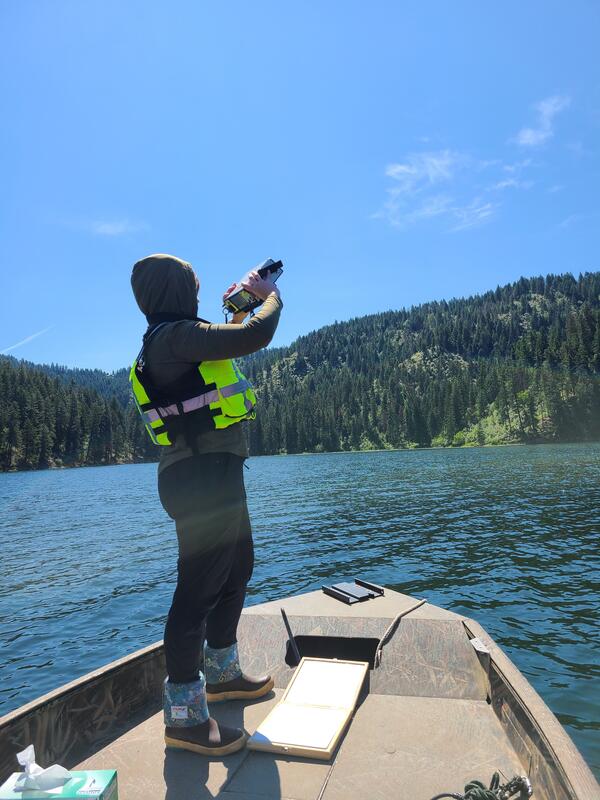
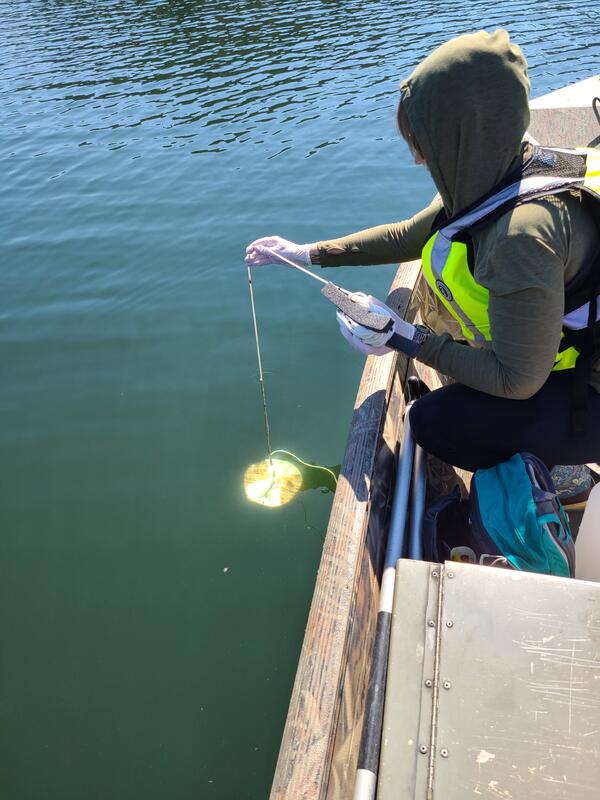
The USGS maintains the world’s largest publicly available water-quality monitoring network (see National Water Dashboard) and maintains high standards for data collection, processing, review, and publication. We use these laboratory and in-situ observations to develop and test remote sensing models that convert satellite signals into water-quality information.
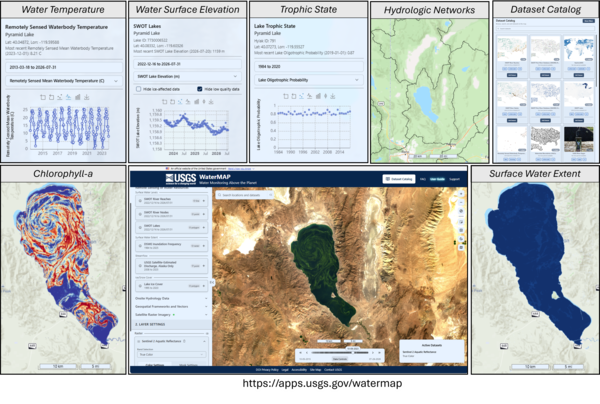
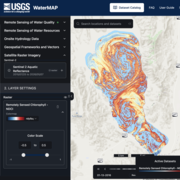
USGS brings remotely sensed water information to the public through WaterMAP (Water Monitoring Above the Planet), which is an interactive web application that delivers comprehensive views of water conditions across rivers, lakes, and reservoirs in the U.S.
How remote sensing of water quality works
Remote sensing data can come from sensors deployed on satellites, cameras deployed near rivers and lakes, or cameras carried by drones, boats or people in the field. Sensors onboard satellites hundreds of miles above the earth’s surface measure sunlight reflected from rivers and lakes. Light measured at the satellite has passed through the atmosphere twice, once from the sun to the earth’s surface, and again from the earth’s surface back to the satellite. As light passes through the atmosphere, some light is absorbed and scattered by particles and gases. These interactions are accounted for in processing satellite imagery in a process known as ‘atmospheric correction’. The USGS atmospherically corrects data from the Sentinel-2 satellites and uses those data to estimate two water quality parameters: Chlorophyll and Turbidity.
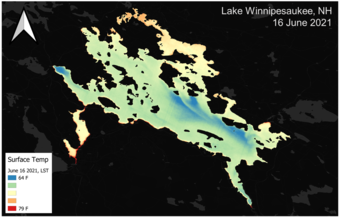
Water temperature, another important water-quality parameter, can also be monitored by satellites, using thermal infrared sensors to measure longwave radiation. USGS uses data from the Landsat 8-9 satellites to estimate water temperature for rivers and lakes wider than 100 m.
As with all remote sensing methods, remote sensing of water-quality requires ground-truthing and should be used in concert with understanding of local systems where the data are applied.
Algorithms that predict observed water quality from satellite data are trained on in-situ observations and tested on a separate set of observations. Testing predicted water quality from remote sensing against in-situ measurements is critical to understanding model limitations and accuracy.
Trained and tested algorithms are applied to each new satellite image as it is collected to produce maps of water quality and water temperature. Web tools like WaterMAP are then used to display the results.
Testing predicted water quality from remote sensing against in-situ measurements is critical to understanding model limitations and accuracy.

WaterMAP: Water Monitoring Above the Planet
The USGS Water Resources Mission Area develops state-of-the-art remote sensing and satellite technology to monitor water quality across the United States. Remote sensing allows us to track water quality conditions and monitor potentially hazardous events like harmful algal blooms in every lake and river in the country that is 100 m or more in width.
What is in the water impacts its appearance. The color of water varies because of how light, water, and substances in the water interact. Clear water has a different color than water laden with sediment (which is often brown), which has a different color than water with a high concentration of algae (which is often green).
Measuring the color of water allows us to identify water quality. Lots of red light? Likely high in sediment. Lots of green and near-infrared light? Likely high in aquatic chlorophyll, and algae indicator. Models that categorize the color of water can be used to assign waterbody trophic state and to map water quality categories within and among waterbodies.
Leaders in the field
The USGS maintains the world’s largest publicly available water-quality monitoring network (see National Water Dashboard) and maintains high standards for data collection, processing, review, and publication. We use these laboratory and in-situ observations to develop and test remote sensing models that convert satellite signals into water-quality information.
USGS brings remotely sensed water information to the public through WaterMAP (Water Monitoring Above the Planet), which is an interactive web application that delivers comprehensive views of water conditions across rivers, lakes, and reservoirs in the U.S.
How remote sensing of water quality works
Remote sensing data can come from sensors deployed on satellites, cameras deployed near rivers and lakes, or cameras carried by drones, boats or people in the field. Sensors onboard satellites hundreds of miles above the earth’s surface measure sunlight reflected from rivers and lakes. Light measured at the satellite has passed through the atmosphere twice, once from the sun to the earth’s surface, and again from the earth’s surface back to the satellite. As light passes through the atmosphere, some light is absorbed and scattered by particles and gases. These interactions are accounted for in processing satellite imagery in a process known as ‘atmospheric correction’. The USGS atmospherically corrects data from the Sentinel-2 satellites and uses those data to estimate two water quality parameters: Chlorophyll and Turbidity.
Water temperature, another important water-quality parameter, can also be monitored by satellites, using thermal infrared sensors to measure longwave radiation. USGS uses data from the Landsat 8-9 satellites to estimate water temperature for rivers and lakes wider than 100 m.
As with all remote sensing methods, remote sensing of water-quality requires ground-truthing and should be used in concert with understanding of local systems where the data are applied.
Algorithms that predict observed water quality from satellite data are trained on in-situ observations and tested on a separate set of observations. Testing predicted water quality from remote sensing against in-situ measurements is critical to understanding model limitations and accuracy.
Trained and tested algorithms are applied to each new satellite image as it is collected to produce maps of water quality and water temperature. Web tools like WaterMAP are then used to display the results.
Testing predicted water quality from remote sensing against in-situ measurements is critical to understanding model limitations and accuracy.