
Northeast Region Photo Contest Winner | November 2018 | USGS at Work
N. Cheung leaving Rockway Inlet NY tide station
Images
Explore our planet through photography and imagery, including climate change and water all the way back to the 1800s when the USGS was surveying the country by horse and buggy.
Filter Total Items: 21343

N. Cheung leaving Rockway Inlet NY tide station
Northeast Region Photo Contest Winner | November 2018 | USGS at Work
N. Cheung leaving Rockway Inlet NY tide station

Strong hurricane impacts predicted for many Panhandle beaches
Strong hurricane impacts predicted for many Panhandle beachesCoastal Change Storm Hazard Team map created Tuesday, 10/89/18 showing current forecasted beach erosion, overwash and inundation effects of Hurricane Michael's predicted landfall in the Florida Panhandle. Forecast will change with subsequent National Hurricane Center forecasts.

USGS ecologists prepare for a drone flight over a burn area
USGS ecologists prepare for a drone flight over a burn areaUSGS ecologist and drone pilot Chase Freeman and technician Kylie Mosher prepare for a drone flight at Whiskeytown National Recreation Area.
USGS ecologists prepare for a drone flight over a burn area
USGS ecologists prepare for a drone flight over a burn areaUSGS ecologist and drone pilot Chase Freeman and technician Kylie Mosher prepare for a drone flight at Whiskeytown National Recreation Area.

Volunteers mark lake sturgeon at the NYSDEC Oneida Hatchery
Volunteers mark lake sturgeon at the NYSDEC Oneida HatcheryVolunteers mark lake sturgeon at the NYSDEC Oneida Hatchery
Volunteers mark lake sturgeon at the NYSDEC Oneida Hatchery
Volunteers mark lake sturgeon at the NYSDEC Oneida HatcheryVolunteers mark lake sturgeon at the NYSDEC Oneida Hatchery
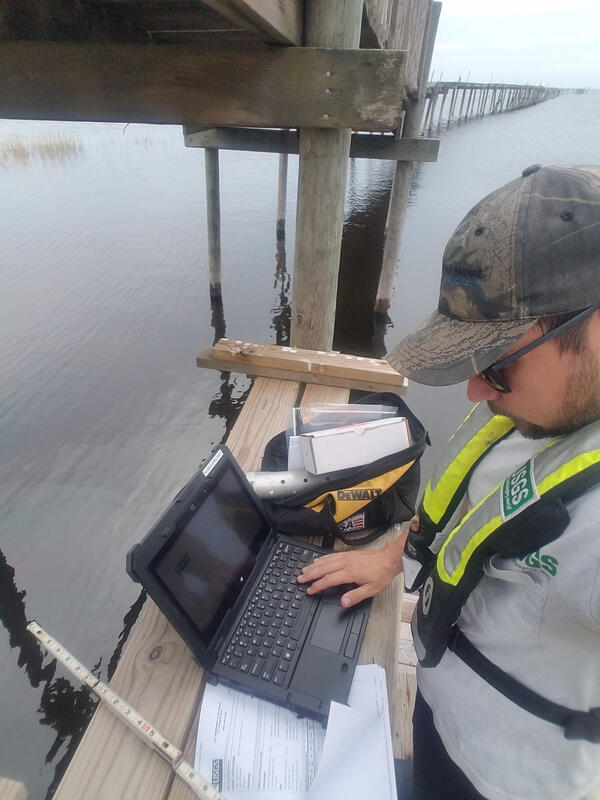
A USGS hydrographer multi-tasking as he installs storm-tide sensors
A USGS hydrographer multi-tasking as he installs storm-tide sensorsBrett Johnston, USGS hydrographer, enters storm-tide sensor information into a USGS data management system on October 8 near Fish Creek, Florida. USGS Photo by Brett Johnston.

Collecting flood data on the Llano River in response to a flash flood
Collecting flood data on the Llano River in response to a flash floodUSGS scientist Scott Grzyb reviews high-water data collected by boat on the Llano River in Llano, Texas in response to a flash flood on October 8, 2018.
Collecting flood data on the Llano River in response to a flash flood
Collecting flood data on the Llano River in response to a flash floodUSGS scientist Scott Grzyb reviews high-water data collected by boat on the Llano River in Llano, Texas in response to a flash flood on October 8, 2018.

End of a long day collecting flood data on the Llano River
End of a long day collecting flood data on the Llano RiverUSGS scientists Scrott Grzyb and Michael Scheider pause at sunset at the end of a long day collecting high-water measurements along the Llano River on October 8, 2018.
End of a long day collecting flood data on the Llano River
End of a long day collecting flood data on the Llano RiverUSGS scientists Scrott Grzyb and Michael Scheider pause at sunset at the end of a long day collecting high-water measurements along the Llano River on October 8, 2018.

A saltmarsh platform
Photo of a saltmarsh platform showing vegetation on on top of the banks of a tidal creek. It shows the general setting of a saltmarshes that experience wet and dry periods with the tides within a day.
Photo of a saltmarsh platform showing vegetation on on top of the banks of a tidal creek. It shows the general setting of a saltmarshes that experience wet and dry periods with the tides within a day.

Examining core stratigraphy within Humboldt slough
Examining core stratigraphy within Humboldt sloughHumboldt State University Assistant Professor Melanie Michalak (squatting) and California State Geological Survey scientist Jay Patton (standing, center) explaining core stratigraphy within Humboldt slough and evidence for past tsunami inundation.

USGS researchers fly a drone over Whiskeytown National Recreation Area
USGS researchers fly a drone over Whiskeytown National Recreation AreaUSGS ecologist and drone pilot Chase Freeman flies a drone for at Whiskeytown National Recreation Area to assess the impacts of the 2018 Carr Fire, while technician Kylie Mosher looks on.

Quarry walls showing dipping sedimentary rocks of Newark Basin, Penn.
Quarry walls showing dipping sedimentary rocks of Newark Basin, Penn.Photograph showing dipping sedimentary rocks of the Newark Basin in southeastern Pennsylvania. Taken during the 2018 Field Conference of Pennsylvania Geologists.

Thermal map of Kīlauea Caldera
This thermal map was constructed by merging about 1300 images from a morning helicopter overflight, and shows the distribution of some of the prominent thermal features in the caldera. The most conspicuous area is a region of high temperatures in the deepest part of the collapse depression, in the area of Halema‘uma‘u.
This thermal map was constructed by merging about 1300 images from a morning helicopter overflight, and shows the distribution of some of the prominent thermal features in the caldera. The most conspicuous area is a region of high temperatures in the deepest part of the collapse depression, in the area of Halema‘uma‘u.

Salt Marsh Coring
NAGT summer intern, Kelly Sanks, prepares to collect salt marsh sediment cores with her advisor, Dr. Meagan Gonneea (Cape Cod, MA).
NAGT summer intern, Kelly Sanks, prepares to collect salt marsh sediment cores with her advisor, Dr. Meagan Gonneea (Cape Cod, MA).

Tanana River at Big Delta sonar and debris on a bridge
Tanana River at Big Delta sonar and debris on a bridgeTanana River at Big Delta sonar and debris on a bridge
Tanana River at Big Delta sonar and debris on a bridge
Tanana River at Big Delta sonar and debris on a bridgeTanana River at Big Delta sonar and debris on a bridge

USGS science on a map of the Carolinas after Hurricane Florence
USGS science on a map of the Carolinas after Hurricane FlorenceThis flood event viewer map, dated Oct. 3, 2018, shows the extent and type of information collected by USGS hydrologists in North and South Carolina in the wake of historic flooding brought on by Hurricane Florence.

Cyanobacterial bloom at Ash River Harbor near Voyageurs National Park
Cyanobacterial bloom at Ash River Harbor near Voyageurs National ParkA cyanobacterial bloom in late fall at Ash River Harbor in Kabetogama Lake, Voyageurs National Park
Cyanobacterial bloom at Ash River Harbor near Voyageurs National Park
Cyanobacterial bloom at Ash River Harbor near Voyageurs National ParkA cyanobacterial bloom in late fall at Ash River Harbor in Kabetogama Lake, Voyageurs National Park

Cyanobacterial bloom at Ash River Harbor near Voyageurs National Park
Cyanobacterial bloom at Ash River Harbor near Voyageurs National ParkCyanobacterial bloom at Kabetogama Lake in Voyageurs National Park
Cyanobacterial bloom at Ash River Harbor near Voyageurs National Park
Cyanobacterial bloom at Ash River Harbor near Voyageurs National ParkCyanobacterial bloom at Kabetogama Lake in Voyageurs National Park

Cyanobacterial bloom at Ash River Harbor near Voyageurs National Park
Cyanobacterial bloom at Ash River Harbor near Voyageurs National ParkCyanobacterial bloom in Kabetogama Lake with fall leaves in the background
Cyanobacterial bloom at Ash River Harbor near Voyageurs National Park
Cyanobacterial bloom at Ash River Harbor near Voyageurs National ParkCyanobacterial bloom in Kabetogama Lake with fall leaves in the background

Flooding at Vekol Wash, Arizona
Flooding at Vekol Wash today, south of Phoenix, following remnant rains from Hurricane Rosa.
Flooding at Vekol Wash today, south of Phoenix, following remnant rains from Hurricane Rosa.

Major John Wesley Powell, a series of three photos, number 1
Major John Wesley Powell, a series of three photos, number 1Typed information on back of photograph: Major John Wesley Powell, a series of three photos, number 1.
Major John Wesley Powell, a series of three photos, number 1
Major John Wesley Powell, a series of three photos, number 1Typed information on back of photograph: Major John Wesley Powell, a series of three photos, number 1.

Rock Castle, VA
View looking west from the Brushy Mountains, NC, to the Blue Ridge escarpment and highlands of the Blue Ridge. The high jagged peak toward the left side of the photo is Grandfather Mountain and is covered by a winter snow.
View looking west from the Brushy Mountains, NC, to the Blue Ridge escarpment and highlands of the Blue Ridge. The high jagged peak toward the left side of the photo is Grandfather Mountain and is covered by a winter snow.