
Sunset photo taken during Cape Cod Bay sea-floor mapping cruise.
Images
Coastal and Marine Hazards and Resources Program images.
Filter Total Items: 2413

Sunset in Cape Cod Bay
Sunset photo taken during Cape Cod Bay sea-floor mapping cruise.

Recovering an instrumented tripod
The instrumented tripod is successfully brought onboard for data download.
The instrumented tripod is successfully brought onboard for data download.

Solar-powered, satellite-uplinked GPS base station at Fire Island
Solar-powered, satellite-uplinked GPS base station at Fire IslandUSGS scientist B.J. Reynolds sets up a solar-powered, satellite-uplinked GPS base station in the Fire Island Wilderness Area to support detailed elevation surveys.
Solar-powered, satellite-uplinked GPS base station at Fire Island
Solar-powered, satellite-uplinked GPS base station at Fire IslandUSGS scientist B.J. Reynolds sets up a solar-powered, satellite-uplinked GPS base station in the Fire Island Wilderness Area to support detailed elevation surveys.

Deck work
Members of the science party and the crew of R/V Rachel Carson work to recover an instrumented tripod.
Members of the science party and the crew of R/V Rachel Carson work to recover an instrumented tripod.

Subbottom profiler deployment on Cape Cod Bay, 2019
Subbottom profiler deployment on Cape Cod Bay, 2019Before deploying the subbottom profiler for leg 2 of the seafloor mapping cruise, Wayne Baldwin, Alex Nichols, and Chuck Worley made sure the floats were sufficiently inflated. In the relatively shallow waters of Cape Cod Bay, they want the instrument towed at water's surface for the resolution of the sub seafloor geology.

Sound velocity casts on Cape Cod Bay
Sometimes the fog can be as thick as pea soup! The captains use radar and keen eyesight to navigate in such conditions. Woods Hole Coastal and Marine Science Center staff, Alex Nichols and Wayne Baldwin, take a sound velocity cast off the back of the boat.
Sometimes the fog can be as thick as pea soup! The captains use radar and keen eyesight to navigate in such conditions. Woods Hole Coastal and Marine Science Center staff, Alex Nichols and Wayne Baldwin, take a sound velocity cast off the back of the boat.

Boston, MA cityscape
Heading back to Cape Cod Bay after a crew change in Boston, MA
Heading back to Cape Cod Bay after a crew change in Boston, MA

Let me process this
Seth Ackerman processing the seafloor mapping data as they are collected on the Cape Cod Bay 2019 research cruise.
Seth Ackerman processing the seafloor mapping data as they are collected on the Cape Cod Bay 2019 research cruise.

Tres Palmas video webcam snapshot
Four video cameras look westward over the coast and the coral reef at Tres Palmas in Rincón, on the west coast of Puerto Rico. Two cameras look out at the horizon and over the ocean for the mid-field view; one camera offers a zoomed-in, far-field view overlooking the reef and out to the island of Desecheo, a U.S.
Four video cameras look westward over the coast and the coral reef at Tres Palmas in Rincón, on the west coast of Puerto Rico. Two cameras look out at the horizon and over the ocean for the mid-field view; one camera offers a zoomed-in, far-field view overlooking the reef and out to the island of Desecheo, a U.S.

Camera 1 Snapshot at Tres Palmas, Puerto Rico
Video camera snapshot at Tres Palmas in Rincón, on the west coast of Puerto Rico.
Video camera snapshot at Tres Palmas in Rincón, on the west coast of Puerto Rico.

Web video cameras mounted on pole in Puerto Rico
Four video cameras look westward over the coast and the coral reef at Tres Palmas in Rincón, on the west coast of Puerto Rico. Two cameras look out at the horizon and over the ocean for the mid-field view; one camera offers a zoomed-in, far-field view overlooking the reef and out to the island of Desecheo, a U.S.
Four video cameras look westward over the coast and the coral reef at Tres Palmas in Rincón, on the west coast of Puerto Rico. Two cameras look out at the horizon and over the ocean for the mid-field view; one camera offers a zoomed-in, far-field view overlooking the reef and out to the island of Desecheo, a U.S.

Tres Palmas, Rincon, Puerto Rico
Photograph collected from a UAS flown over the beach at Tres Palmas in Rincón, Puerto Rico.
Photograph collected from a UAS flown over the beach at Tres Palmas in Rincón, Puerto Rico.

Sunrise in Melbourne, FL
A colorful sunrise appears over the horizon of a calm ocean offshore of Melbourne, Florida. USGS Scientist RC Mickey collects data for location and elevation of sea turtle crawls and associated beach profiles this stretch of coastline.
A colorful sunrise appears over the horizon of a calm ocean offshore of Melbourne, Florida. USGS Scientist RC Mickey collects data for location and elevation of sea turtle crawls and associated beach profiles this stretch of coastline.

Elevation survey in the Jones River, Kingston, MA
Research scientist Meagan Gonneea and USGS intern Angela Trejo survey the Jones River in Kingston, MA. Removal of a dam across the Jones River began July 15, 2019, as a first step to restore river habitat, which is particularly critical for herring passage from the sea to inland lakes for spawning.
Research scientist Meagan Gonneea and USGS intern Angela Trejo survey the Jones River in Kingston, MA. Removal of a dam across the Jones River began July 15, 2019, as a first step to restore river habitat, which is particularly critical for herring passage from the sea to inland lakes for spawning.

Aerial photo of estuary
Aerial view of a gas flux tower in Great Barnstable Marsh in Barnstable, Massachusetts.
Aerial view of a gas flux tower in Great Barnstable Marsh in Barnstable, Massachusetts.

SQUID-5 - Structure-from-Motion Quantitative Underwater Imaging Device
SQUID-5 - Structure-from-Motion Quantitative Underwater Imaging DeviceThe SQUID-5, or a Structure-from-Motion (SfM) Quantitative Underwater Imaging Device with 5 cameras is a towed surface vehicle with an onboard Global Navigation Satellite System (GNSS) and 5 downward-looking cameras with overlapping views of the seafloor.
Barry's wave, surge likely to affect beaches in four states
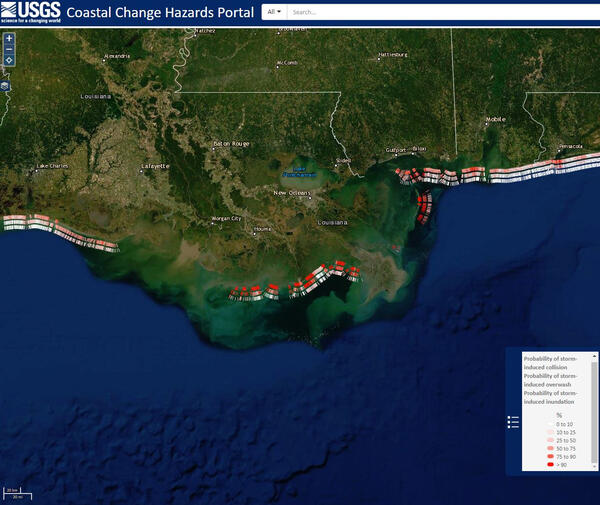
Barry's wave, surge likely to affect beaches in four statesThis Coastal Change Storm Hazard Team map was created Friday, July 12, 2019 and shows forecast beach erosion (the strip of colored bars closest to the coast), overwash (middle strip) and inundation (outer strip) effects of Tropical Storm Barry’s predicted landfall in Louisiana.
Barry's wave, surge likely to affect beaches in four states
Barry's wave, surge likely to affect beaches in four statesThis Coastal Change Storm Hazard Team map was created Friday, July 12, 2019 and shows forecast beach erosion (the strip of colored bars closest to the coast), overwash (middle strip) and inundation (outer strip) effects of Tropical Storm Barry’s predicted landfall in Louisiana.

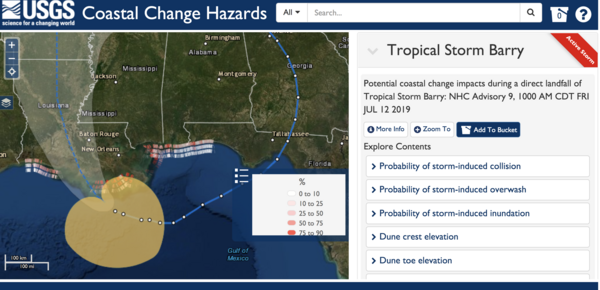
These Gulf beaches are forecast to be affected by Barry
These Gulf beaches are forecast to be affected by BarryThis Coastal Change Storm Hazard Team map was created Thursday, July 11, 2019 and shows forecast beach erosion (the strip of colored bars closest to the coast), overwash (middle strip) and inundation (outer strip) effects of Tropical Storm Barry’s predicted landfall in Louisiana.

Barry forecast to affect beaches in four Gulf states
Barry forecast to affect beaches in four Gulf statesThis Coastal Change Storm Hazard Team map was created Thursday, July 11, 2019 and shows forecast beach erosion (the strip of colored bars closest to the coast), overwash (middle strip) and inundation (outer strip) effects of Tropical Storm Barry’s predicted landfall in Louisiana.

SQUID-5 in the water
The SQUID-5 is an acronym for a Structure-from-Motion (SfM) Quantitative Underwater Imaging Device with 5 cameras.
The SQUID-5 is an acronym for a Structure-from-Motion (SfM) Quantitative Underwater Imaging Device with 5 cameras.