
This diagram, released in 2022, depicts the global water cycle. It shows how human water use affects where water is stored, how it moves, and how clean it is. This diagram is available in English and Spanish.
Jennifer L Bruce (Former Employee)
Science and Products
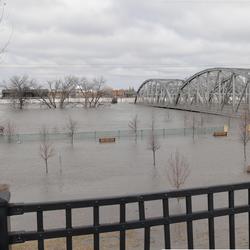
Flood Inundation Mapping (FIM) Program
The USGS Flood Inundation Mapping (FIM) Program helps communities protect lives and property by providing tools and information to help them understand their local flood risks and make cost-effective mitigation decisions.
Water Cycle Diagrams
Learn more about where water is on Earth and how it moves using one of the USGS water cycle diagrams. We offer downloadable and interactive versions of the water cycle diagram in English, the official language and authoritative version of all federal information. In addition, our diagrams are available in multiple languages. In addition our diagrams are available in multiple languages. Explore our...

Geographic Searches for USGS Publications (Bureau-wide Application)
The purpose of this project is to improve the USGS Publications Warehouse (Pubs Warehouse) so that a person can search for USGS publications by geographic region in addition to existing search criteria; for example, one could search using map zooms or congressional districts. The addition of geographic searches allows users to narrow their search results to specific areas of interest...

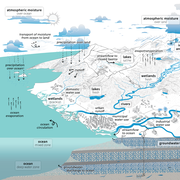
The Water Cycle (PNG)
This diagram, released in 2022, depicts the global water cycle. It shows how human water use affects where water is stored, how it moves, and how clean it is. This diagram is available in English and Spanish.
Science and Products
Flood Inundation Mapping (FIM) Program
The USGS Flood Inundation Mapping (FIM) Program helps communities protect lives and property by providing tools and information to help them understand their local flood risks and make cost-effective mitigation decisions.
Water Cycle Diagrams
Learn more about where water is on Earth and how it moves using one of the USGS water cycle diagrams. We offer downloadable and interactive versions of the water cycle diagram in English, the official language and authoritative version of all federal information. In addition, our diagrams are available in multiple languages. In addition our diagrams are available in multiple languages. Explore our...
Geographic Searches for USGS Publications (Bureau-wide Application)
The purpose of this project is to improve the USGS Publications Warehouse (Pubs Warehouse) so that a person can search for USGS publications by geographic region in addition to existing search criteria; for example, one could search using map zooms or congressional districts. The addition of geographic searches allows users to narrow their search results to specific areas of interest...
The Water Cycle (PNG)
This diagram, released in 2022, depicts the global water cycle. It shows how human water use affects where water is stored, how it moves, and how clean it is. This diagram is available in English and Spanish.
This diagram, released in 2022, depicts the global water cycle. It shows how human water use affects where water is stored, how it moves, and how clean it is. This diagram is available in English and Spanish.