Limited mixing of orange water and the Kugururok River
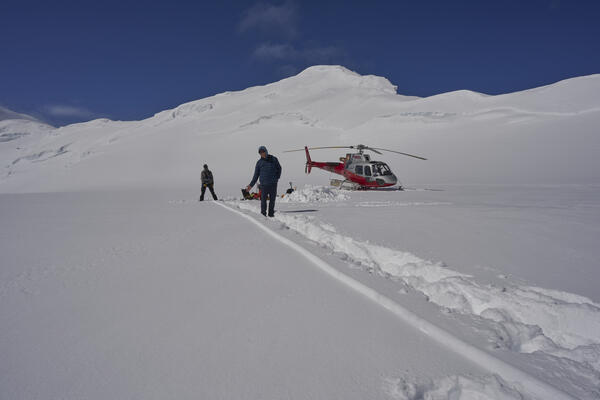
Limited mixing of orange water and the Kugururok RiverOrange streams are increasingly common in the Brooks Range of northern Alaska. The orange stream color reflects oxidized iron, but also often indicates elevated heavy metal concentrations. Our ongoing study aims to document these occurrences and the timing of their onset.