
An automated cable system pulls measuring equipment across the Klamath River near Keno Oregon (11510700).
Images
Check out photos of some of the awesome work USGS scientists and field technicians have done over the years.
Filter Total Items: 377
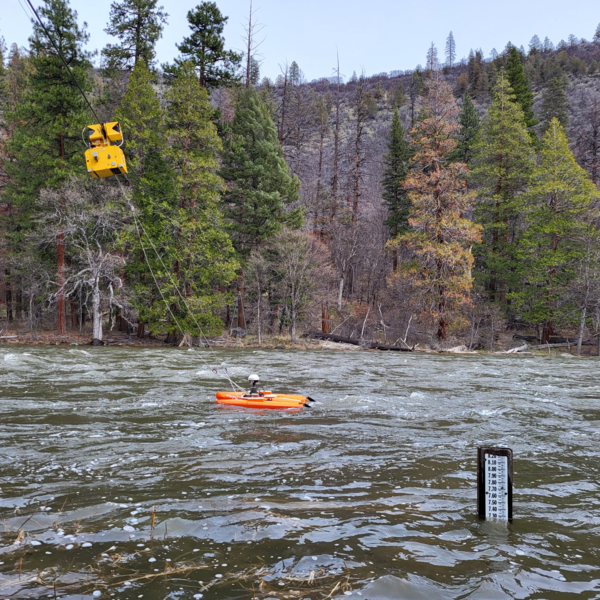
Klamath River flow measurement
An automated cable system pulls measuring equipment across the Klamath River near Keno Oregon (11510700).
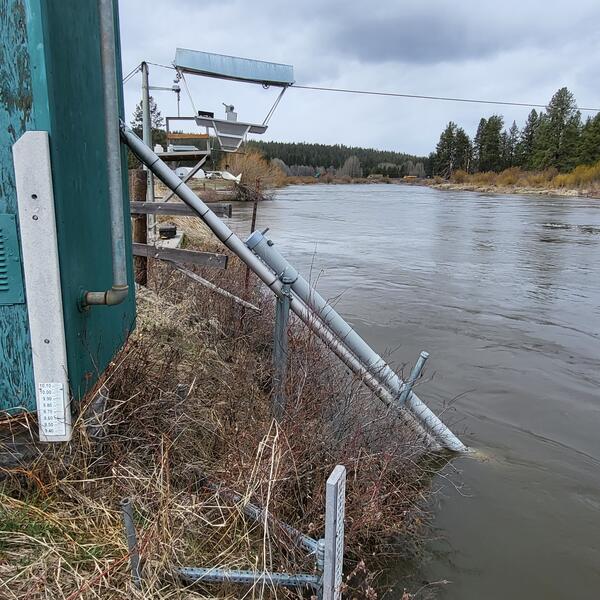
Williamson River below Sprague River near Chiloquin, OR
Williamson River below Sprague River near Chiloquin, ORWilliamson River below Sprague River near Chiloquin, OR in the spring during low-flow conditions. View data.
Williamson River below Sprague River near Chiloquin, OR
Williamson River below Sprague River near Chiloquin, ORWilliamson River below Sprague River near Chiloquin, OR in the spring during low-flow conditions. View data.
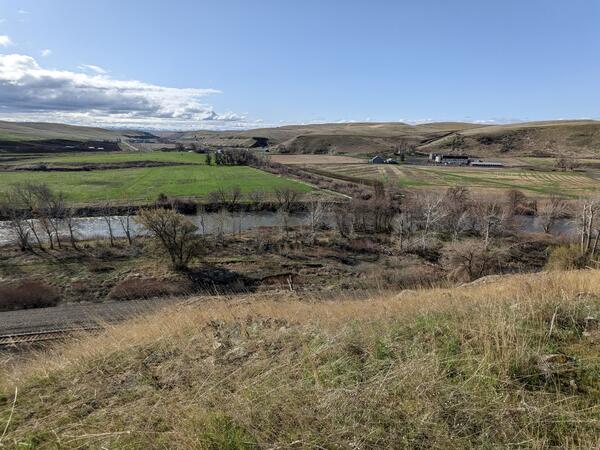
Umatilla River near Birch Creek
Umatilla River near Brich Creek from Rieth Road. The confluence of these two rivers is at a wide alluvial valley bounded by low hills. Birch Creek flows through the straightened ditch lined by bushes in the midground.
Umatilla River near Brich Creek from Rieth Road. The confluence of these two rivers is at a wide alluvial valley bounded by low hills. Birch Creek flows through the straightened ditch lined by bushes in the midground.

Collecting velocity data on the North-Santiam
Researcher using an advanced acoustic instrument to collect river velocity data. The river velocity data is used to calibrate and validate hydraulic models.
Researcher using an advanced acoustic instrument to collect river velocity data. The river velocity data is used to calibrate and validate hydraulic models.

Lake Abert Monitoring Gage
Data collection electronics are stored in the metal box. The flex tube connects wiring to sensors and pole where telemetry antennas will be mounted.
Data collection electronics are stored in the metal box. The flex tube connects wiring to sensors and pole where telemetry antennas will be mounted.
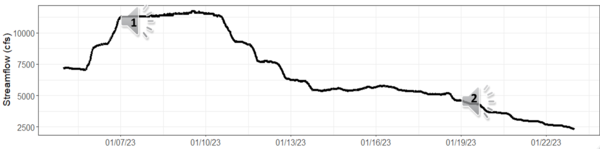
North Santiam at Greens Bridge (14184100)
Graph of streamflow over time at North Santiam at Greens Bridge (14184100) between January 5th - January 22nd, 2023. Two speaker symbols represent the approximate timing of hydrophone audio recordings of river water moving gravel and cobbles along the channel bottom.
Graph of streamflow over time at North Santiam at Greens Bridge (14184100) between January 5th - January 22nd, 2023. Two speaker symbols represent the approximate timing of hydrophone audio recordings of river water moving gravel and cobbles along the channel bottom.

Harney Basin groundwater age
Relative groundwater age in (A) shallow wells that are less than 100 feet deep and (B) deep wells that are greater than 100 feet deep within and next to the Harney Basin, southeastern Oregon. Relative age is based on the analysis of stable isotopes of hydrogen in water and its relation to tritium and carbon-14 age dates.
Relative groundwater age in (A) shallow wells that are less than 100 feet deep and (B) deep wells that are greater than 100 feet deep within and next to the Harney Basin, southeastern Oregon. Relative age is based on the analysis of stable isotopes of hydrogen in water and its relation to tritium and carbon-14 age dates.
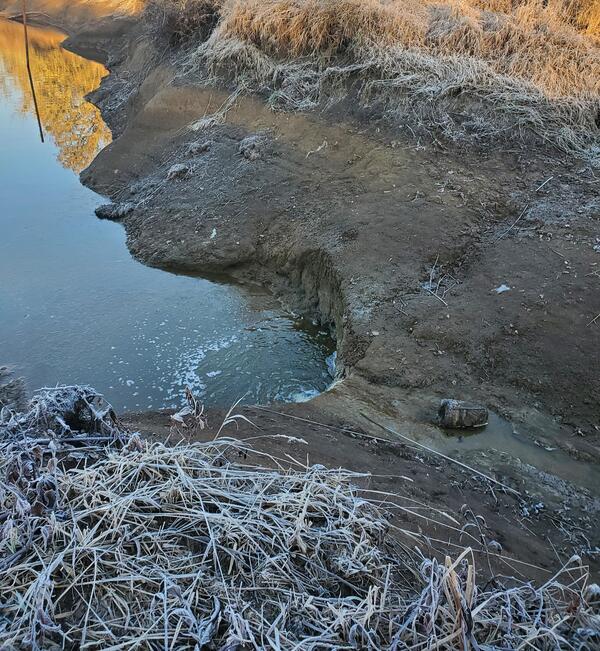
Drainage channel along HWY 126
Drainage channel along HWY 126, near Coyote Creek, OR, where low water levels have exposed a headcut/headward erosion/knickpoint in the sediment.
Drainage channel along HWY 126, near Coyote Creek, OR, where low water levels have exposed a headcut/headward erosion/knickpoint in the sediment.

Lake Abert in the snow
A winter reconnaissance visit at Lake Abert. Data technicians scout out the terrain and lake to plan site installation.
A winter reconnaissance visit at Lake Abert. Data technicians scout out the terrain and lake to plan site installation.

Lake Abert's salty shores
As the water drops large amounts of salt deposits are left behind on the shores of Lake Abert.
As the water drops large amounts of salt deposits are left behind on the shores of Lake Abert.

Central Point Field Office
Side view of Central Point field office. Photo provided by Josh Price for use on ORWSC website.
Side view of Central Point field office. Photo provided by Josh Price for use on ORWSC website.

Crooked River
Image of the Crooked River near our Bend field office in Oregon. Image is looking up stream.
Image of the Crooked River near our Bend field office in Oregon. Image is looking up stream.

Inter-dune coastal scrub and grass barrier island habitat
Inter-dune coastal scrub and grass barrier island habitatInter-dune habitat with a mix of coastal scrub, bare ground, and grass vegetation, on Santa Rosa Island, Gulf Islands National Seashore, FL. The foredune (in background) separates the inter-dune habitat from beach habitat (not visible) behind the foredune.

Willamette River in Portland, Oregon
Photo taken from Tilikum Crossing Bridge looking downstream towards Ross Island Bridge and Ross Island in Portland Oregon.
Photo taken from Tilikum Crossing Bridge looking downstream towards Ross Island Bridge and Ross Island in Portland Oregon.
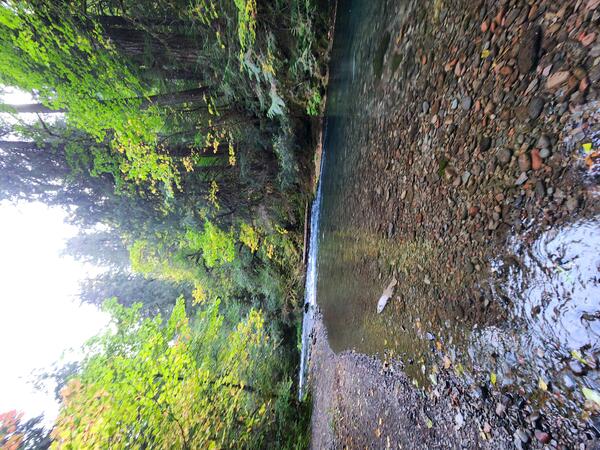
South Fork McKenzie river
A dead salmon in the South Fork McKenzie River. Salmon die after spawning. The cold waters of South Fork McKenzie River contribute to low pre-spawn mortality in this salmon habitat.
A dead salmon in the South Fork McKenzie River. Salmon die after spawning. The cold waters of South Fork McKenzie River contribute to low pre-spawn mortality in this salmon habitat.

Klamath River below JC Boyle Powerplant
One of many stream gages in the Klamath Basin. Solar charged batteries keep the data coming in through the satellite network. View the data.
One of many stream gages in the Klamath Basin. Solar charged batteries keep the data coming in through the satellite network. View the data.
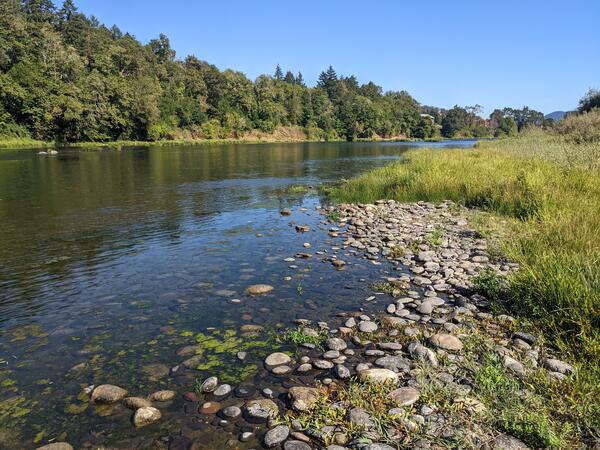
Main Umpqua River near Tyee, Oregon
Photo taken during field work along the Umpqua River.
Photo taken during field work along the Umpqua River.

Lone goose at sunrise at Summer Lake Wildlife Area
Lone goose at sunrise at Summer Lake Wildlife AreaLooking east on Bullgate Pond at sunrise with lone tule white-fronted goose (Anser albifrons elgasi) in upper right, Summer Lake Wildlife Area, near Summer Lake, Oregon.
By
Ecosystems Mission Area, Water Resources Mission Area, Species Management Research Program, Water Availability and Use Science Program, Forest and Rangeland Ecosystem Science Center, Fort Collins Science Center, Nevada Water Science Center, Oregon Water Science Center, Utah Water Science Center, Western Ecological Research Center (WERC), Saline Lake Ecosystems Integrated Water Availability Assessment
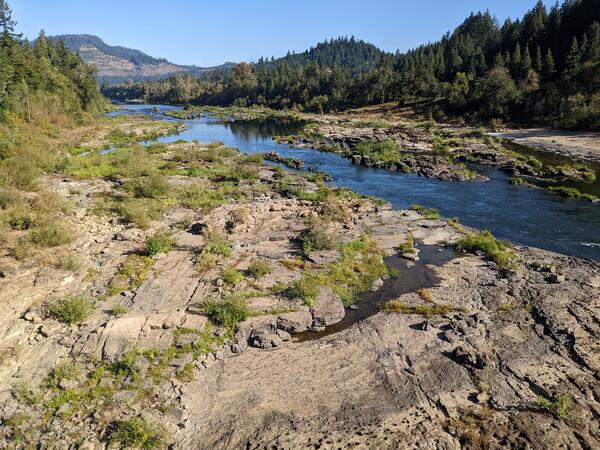
Umpqua River near Coles Valley
The main Umpqua River near Coles Valley. This section of river channel is composed of unconsolidated sediments called alluvium, which make up alluvial valleys.
The main Umpqua River near Coles Valley. This section of river channel is composed of unconsolidated sediments called alluvium, which make up alluvial valleys.

View from the cableway at Fall Creek, OR
Photo taken by Lisa Hoaks while she measured the streamflow of Fall Creek from the cableway. Looking downstream towards Unity Covered Bridge.
Photo taken by Lisa Hoaks while she measured the streamflow of Fall Creek from the cableway. Looking downstream towards Unity Covered Bridge.
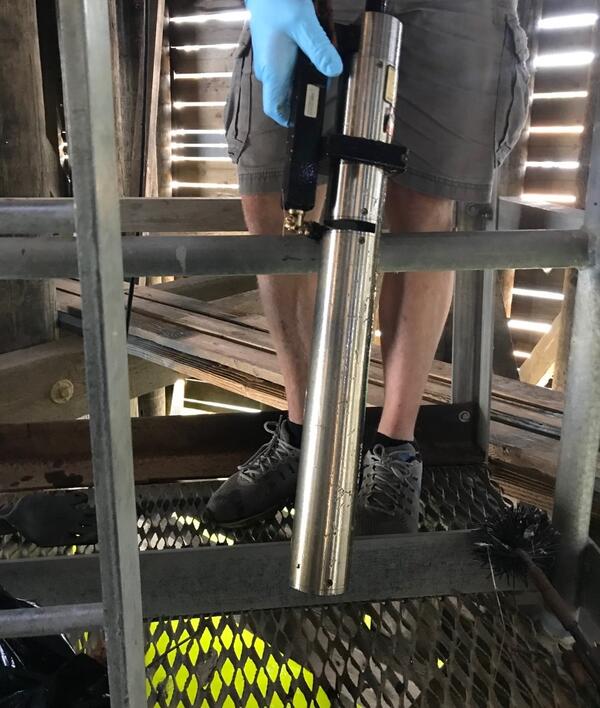
Inspecting Willamette River nitrate sensor
This nitrate sensor detects the unique way nitrate absorbs ultraviolet light and then calculates how much is present. During site visits, technicians clean the optics, check anti-fouling systems, and verify accuracy to keep it running reliably.
This nitrate sensor detects the unique way nitrate absorbs ultraviolet light and then calculates how much is present. During site visits, technicians clean the optics, check anti-fouling systems, and verify accuracy to keep it running reliably.