

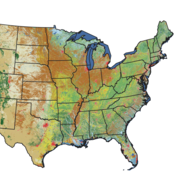
In this episode of Eyes on Earth, we talk about the latest release of the National Land Cover Database (NLCD). More than just a map, NLCD is a stack of maps—a database. It has long been the foundational land cover source for scientists, resource managers, and decision-makers across the United States, and now the next generation of USGS land cover mapping is here.
Annual NLCD Assessment: Phosphate Mining and Land Cover Change
Phosphate rock: Feeding the needs of the world
Phosphate rock: Feeding the needs of the world
By Earth Resources Observation and Science (EROS) Center
December 12, 2024
Populations around the world are increasing (US Census Bureau, 2023). As agriculture tries to keep up with feeding this growing population, the use of phosphate fertilizers has risen (FAO, 2019). Phosphorus is a nutrient required for plant growth, and there is no substitute.
In response, phosphate rock mining capacity has expanded, driven by the increasing value of phosphate rock, improved technologies for access and excavation at mine locations, and more efficient transportation options for moving phosphate ore to fertilizer production plants (Steiner et al., 2015).
Media

Sources/Usage: Public Domain. View Media Details
Phosphate rock mining is the fifth largest mining industry in the United States (EPA, 2024), occurring in four states including Florida, Idaho, North Carolina and Utah. Of the phosphate rock mined in the United States, 95% was used in the manufacture of phosphate fertilizers and animal feed supplements (USGS, 2023).
Sources/Usage: Public Domain. View Media Details

Annual NLCD Reveals Land Change
Annual NLCD Reveals Land Change
Visualization of land cover and land cover change highlights the impact phosphate rock mining has on the landscape. The Annual National Land Cover Database (NLCD), with production led by the U.S. Geological Survey’s Earth Resources Observation and Science (EROS) Center, is the newest generation of land cover and land change information (USGS, 2024).
Annual NLCD offers six products that represent land cover and surface change characteristics across the Lower 48 United States. The products harness the remotely sensed Landsat data record for 38 years to provide scientists, resource managers and decision-makers the land surface change information they require.


Sources/Usage: Public Domain. View Media Details
Media

Sources/Usage: Public Domain. View Media Details
Annual NLCD and Landsat
Annual NLCD and Landsat
Media

Sources/Usage: Public Domain. View Media Details
Landsat images are the ultimate source of information for the derived NLCD land cover changes. Below are animations of land cover change from 1985 to 2023 using Annual NLCD land cover (on the left) and Landsat true-color images (on the right) for Bone Valley and Hamilton County, Florida, where phosphate mining has expanded in all directions over time, changing land cover from year to year.
In the Annual NLCD land cover images, wetlands, grasslands and pastures (light blue, light tan and yellow, respectively) are removed and changed to barren land. Barren land (gray) is exposed as the phosphate rock is excavated and put into slurry ponds before it is transported to a fertilizer production facility. After all marketable phosphate rock is removed, efforts to restore vegetation begin, returning land cover back to grassland, shrubland and wetland. Some lakes and ponds are created as well in the final restoration process.
Bone Valley
Bone Valley
Media

Sources/Usage: Public Domain. View Media Details
Hamilton County
Hamilton County
Media

Sources/Usage: Public Domain. View Media Details
Phosphate Mining in Bone Valley
Phosphate Mining in Bone Valley
Mining in Florida began in 1880s, and the region of Florida known as Bone Valley is still considered one of the most economically accessible phosphate deposits in the world, accounting for more than 60 percent of U.S. production (FLDEP, 2024 and FIPR Institute, 2020).
In Bone Valley, the geologic formation with embedded phosphate rock is under 15 to 50 feet of easily removed soil and vegetation (FIPR Institute, 2020). Approximately 25 percent of the Bone Valley area mined was originally wetland or open water. Much of the rest was grassland/shrubland.
Images below: Annual NLCD Land Cover Change is shown color-coded by the number of times an area changes between 1985 and 2023. The four counties around Bone Valley are shown on the left to provide a wider view, while a zoomed-in view of Bone Valley on the right provides a more detailed look at change.


Media

Sources/Usage: Public Domain. View Media Details
Ideal Location
What makes central Florida good for mining? Aside from easy access to the phosphate rock with draglines, transportation and industrial infrastructure are the backbone to mining success. Railroads, ore handling systems including conveyers and pipelines, and processing plants that turn the ore into phosphate fertilizers are regionally located. The Port of Tampa is vital to movement of the finished product to other areas of use in the United States, as well as for export.
Media

Sources/Usage: Public Domain. View Media Details
Draglines (above) are used to remove existing land cover (grassland/shrubland, wetland, or water), exposing bare ground, including here east of Parrish, Florida. One dragline can excavate 15 acres in a month (FIPR Institute).
Media

Sources/Usage: Public Domain. View Media Details
Sources/Usage: Public Domain. View Media Details

Some Effects of Phosphate Mining
Some Effects of Phosphate Mining
Media

Sources/Usage: Public Domain. View Media Details
Phosphogypsum is a byproduct of the fertilizer manufacturing process. Five tons are generated for every ton of fertilizer. About 30 million new tons are generated each year. In Florida, this waste product is stored in large mounds called stacks. About 1 billion tons of phosphogypsum are piled up in 25 stacks across Florida. Some stacks can cover hundreds of acres and be a hundred feet high. Water covers the top of some stacks (EPA, 2024).
The integrity of the stacks is threatened by natural disasters such as hurricanes, flooding and sinkholes (Biesecker, M., and Dearen J., 2024). In other areas of the world, phosphogypsum is used as a construction material or raw material in chemical manufacturing (FIPR Institute, 2020).
Eutrophication due to phosphate fertilizer use is probably one of the most notable impacts on the environment, society and the economy. Consequences of eutrophication include blooms of potentially harmful algae that deplete the amount of oxygen in water and can lead to aquatic dead zones (Conley et al., 2009). Phosphorus from overfertilized soils is one of the most widespread water pollutants.
Media

Sources/Usage: Public Domain. View Media Details
Background image: An algae bloom around a dock at Lake Brant in South Dakota is an example of eutrophication. USGS photo by Jennifer Rover
Sources/Usage: Public Domain. View Media Details

Mining Process Ends in Restoration
Mining Process Ends in Restoration
Media

Sources/Usage: Public Domain. View Media Details
In the United States, the mining process begins long before there are changes to the landscape, with planning, permits, environmental reviews and investor funding. In areas with known reserves, new permits are submitted yearly for new mines or the replacement and reopening of older mines (USGS, 2023). The cycle from rock to fertilizer takes place over a relatively short period of time in any one location.
An original permit for a mine includes a requirement for restoration, the final process to follow when mining is complete. Restoration is required to fill in surface holes and replace the bare ground with grass or other vegetation, while sometimes keeping a pond. Some restored areas of a mine are approved for uses such as parks, cattle grazing, citrus groves and golf courses (FIPR Institute, 2020).
Global Phosphate Resources and Use
Global Phosphate Resources and Use
There are more than 300 billion tons of phosphate rock resources around the world (USGS, 2023). These resources provide the ultimate source of phosphorus for phosphate-based fertilizers.
Media

Sources/Usage: Public Domain. View Media Details
The growing populations in Asia and South America lead the demand for phosphate fertilizers (USGS, 2024; FAO, 2019), while relying on imports to meet their needs from countries with the largest marketable reserves and processing plants. Phosphate rock and fertilizer global supply security is regularly in flux due to climate effects on food production and supply chain disruptions caused by wars, pandemics, natural disasters and economic instability (FAO, 2019).
Media

Sources/Usage: Public Domain. View Media Details
About Annual NLCD
About Annual NLCD
The Annual NLCD science initiative is implemented at the U.S. Geological Survey (USGS) Earth Resources Observation and Science Center. Find more information about the Annual NLCD initiative and Annual NLCD Science Products below.
Annual NLCD Website
Annual NLCD Website
Annual NLCD Website
Data Access Options
Data Access Options
Data Access Options
Annual NLCD Products
Annual NLCD Products
Annual NLCD Products
References
Biesecker, M. and Dearen J., 2024, Polluted waste from Florida’s fertilizer industry is in the path of Milton’s fury; in AP News, Climate section, Updated 6:54 PM MDT, October 9, 2024, accessed Oct. 11, 2024 at https://apnews.com/article/hurricane-milton-florida-environment-fertili… 10/21
Conley, D.J., Paerl, H.W., Howarth, R.W., Boesch, D.F., Seitzinger, S.P., Havens, K.E., Lancelot, C., and Likens, G.E., 2009, Ecology controlling eutrophication: nitrogen and phosphorus; Science 323 (5917), 1014–1015.
Food and Agriculture Organization (FAO) of the UN, 2019, World fertilizer trends and outlook to 2022, Rome 2019, accessed Oct. 11, 2024, at https://books.google.com/books?id=08S8DwAAQBAJ&printsec=frontcover&sour…; 2022 summary report; based on expert view presented at the June 2019 “FAO/Fertilizer Outlook Expert Group” meeting in Rome, Food and Agriculture Organization of the United Nations, Rome.
Florida Industrial and Phosphate Research Institute (FIPR Institute), 2020, Phosphate Primer; Florida Polytechnec University, Retrieved May 20, 2020 from https://fipr.floridapoly.edu/about-us/phosphate-primer/index.php
Florida Department of Environmental Protection (FLDEP), 2024, Florida’s Phosphate Mines, updated August 26, 2024; Retrieved 10 October, 2024 from https://floridadep.gov/water/mining-mitigation/content/phosphate
U.S. Census Bureau, 2023, Morse, Anne, Global Population Estimates Vary but Trends Are Clear: Population Growth Is Slowing, Nov. 9, 2023, https://www.census.gov/library/stories/2023/11/world-population-estimat… , accessed Oct. 25, 2024
U.S. Environmental Protection Agency (EPA), 2024, Radioactive Material form fertilizer production, accessed on Oct. 25, 2024 at https://www.epa.gov/radtown/radioactive-material-fertilizer-production&…;
U.S. Geological Survey, 2016, Phosphate Rock, [through 2015; last modified January 2016], in Jasinski, S.M., comp., Mineral commodity summary (2016 version): U.S. Geological Survey Data, accessed Sept. 10, 2024 , at https://pubs.usgs.gov/periodicals/mcs2016/mcs2016-phosphate.pdf
U.S. Geological Survey, 2017, Phosphate Rock, [through 2016; last modified January 2017], in Jasinski, S.M., comp., Mineral commodity summary (2017 version): U.S. Geological Survey Data, accessed Sept. 10, 2024 , at https://pubs.usgs.gov/periodicals/mcs2017/mcs2017-phosphate.pdf
U.S. Geological Survey, 2018, Phosphate Rock, [through 2017; last modified January 2018], in Jasinski, S.M., comp., Mineral commodity summary (2018 version): U.S. Geological Survey Data, accessed Sept. 10, 2024 , at https://pubs.usgs.gov/periodicals/mcs2018/mcs2018-phosphate.pdf
U.S. Geological Survey, 2019, Phosphate Rock, [through 2018; last modified January 2019], in Jasinski, S.M., comp., Mineral commodity summary (2019 version): U.S. Geological Survey Data, accessed Sept. 10, 2024 , at https://pubs.usgs.gov/periodicals/mcs2019/mcs2019-phosphate.pdf
U.S. Geological Survey, 2020, Phosphate Rock, [through 2019; last modified January 2020], in Jasinski, S.M., comp., Mineral commodity summary (2020 version): U.S. Geological Survey Data, accessed Sept. 10, 2024 , at https://pubs.usgs.gov/periodicals/mcs2020/mcs2020-phosphate.pdf
U.S. Geological Survey, 2021, Phosphate Rock, [through 2020; last modified January 2021], in Jasinski, S.M., comp., Mineral commodity summary (2021 version): U.S. Geological Survey Data, accessed Sept. 10, 2024 , at https://pubs.usgs.gov/periodicals/mcs2021/mcs2021-phosphate.pdf
U.S. Geological Survey, 2022, Phosphate Rock, [through 2021; last modified January 2022], in Jasinski, S.M., comp., Mineral commodity summary (2022 version): U.S. Geological Survey Data, accessed Sept. 10, 2024 , at https://pubs.usgs.gov/periodicals/mcs2022/mcs2022-phosphate.pdf
U.S. Geological Survey, 2022, Phosphate Rock – Historical Statistics [1900 through 2022; last modified Oct. 10, 2023], in Buckingham, D.A. and Jasinski, S.M., comp., Data Series 140 : U.S. Geological Survey Data, accessed Sept. 10, 2024 , at https://www.usgs.gov/media/files/phosphate-rock-historical-statistics-d…
U.S. Geological Survey, 2023, Phosphate Rock, [through 2022; last modified January 2023], in Jasinski, S.M., comp., Mineral commodity summary (2023 version): U.S. Geological Survey Data, accessed Sept. 10, 2024 , at https://pubs.usgs.gov/periodicals/mcs2023/mcs2023-phosphate.pdf
U.S. Geological Survey, 2024a, Phosphate Rock, [through 2022; last modified January 2024], in Jasinski, S.M., comp., Mineral commodity summary (2024 version): U.S. Geological Survey Data, accessed Sept. 10, 2024 , at https://pubs.usgs.gov/periodicals/mcs2024/mcs2024-phosphate.pdf
U.S. Geological Survey (USGS), 2024b, Annual NLCD Collection 1 Science Products: U.S. Geological Survey data release, https://doi.org/10.5066/P94UXNTS
Related
Learn more details about Annual NLCD and its six products.

Annual National Land Cover Database
Land cover is foundational information for land managers, scientists, and the general public. Many types of scientific studies have applied annual land cover information including projecting future land use, documenting forest fragmentation or conservation practices, modeling wildfire hazards, tracking water quality and quantity, and understanding change in wildlife habitat and ecosystem...
Annual National Land Cover Database Frequently Asked Questions
This page lists commonly asked questions (FAQs) pertaining to Annual National Land Cover Database (NLCD).

Eyes on Earth Episode 126 – Annual NLCD
The next generation of USGS land cover mapping is here. Annual NLCD provides land cover data of the U.S. every year back to 1985.

Annual NLCD Characteristics, Constraints, and Caveats
This page provides information about specific artifacts that were discovered in review of Annual National Land Cover Database (NLCD) Collection 1.0 or provided by user feedback. These show up in the products listed below.

Annual NLCD Science Product User Guide
Annual NLCD Collection 1.1 has been released. Collection 1.1 contains 40 years of annual data from 1985 -2024. This document describes the relevant characteristics of the Annual NLCD, Collection 1.1 Science Products to facilitate their use in the land cover remote sensing community.

Annual NLCD Land Cover Confidence
The land cover confidence represents the probability value for the land cover class derived from the classification method.

Annual NLCD Spectral Change Day of Year
The Annual National Land Cover Database (NLCD) Spectral Change Day of Year product represents the day-of-year (DOY) on which a significant deviation in Landsat surface reflectance was detected within the calendar year of the map product. Spectral changes represent abrupt non-phenological changes in the reflectance of the land surface through time that may or may not be related to land cover change...
Annual NLCD Land Cover Classification
The primary NLCD land cover product represents the predominant thematic land cover class within the mapping year with respect to broad categories of artificial or natural surface cover.

Annual NLCD Land Cover Change
The Annual NLCD land cover change product represents annual land cover change between one product year and the next, with those changes represented in the latter year (e.g., differences in land cover between 1985 and 1986 are shown in the 1986 land cover change product). These differences are represented categorically in the product data by concatenating the before and after land cover class codes...

Annual NLCD Impervious Descriptor
The Annual National Land Cover Database (NLCD) Impervious Descriptor product represents categorical data for developed land cover distinguishing roads from urban non-road.

Annual NLCD Fractional Impervious Surface
The Annual National Land Cover Database (NLCD) impervious surface product represents the fractional surface area of the map unit (pixel) that is covered with artificial substrate or structures. This includes processed materials or structures (pavement, concrete, rooftops, and other constructed materials) that generate surface runoff. The majority of these materials are impervious to water, but...
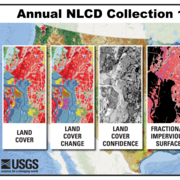
Annual NLCD Product Suite
Annual National Land Cover Database (NLCD) Collection 1.1 includes a suite of six raster land use and land cover science products for the conterminous United States. It covers the period between 1985 and 2024. The Science Product User Guide contains in-depth background and documentation about the Annual NLCD product suite.

About Annual NLCD
Improving information on the characteristics of land cover, understanding the basic drivers of change, and identifying of potential consequences of change on human and natural systems can empower greater insight into the impacts and feedback of human activity and other drivers. To meet its needs, the geospatial community has called for a new generation of monitoring data and information as input...
Listen to an Eyes on Earth podcast and view a webinar about Annual NLCD.
In this episode of Eyes on Earth, we talk about the latest release of the National Land Cover Database (NLCD). More than just a map, NLCD is a stack of maps—a database. It has long been the foundational land cover source for scientists, resource managers, and decision-makers across the United States, and now the next generation of USGS land cover mapping is here.
 National Land Cover Database: Improving on a 30-Year Legacy")
The New Annual (1985-2023) National Land Cover Database: Improving on a 30-Year Legacy
The New Annual (1985-2023) National Land Cover Database: Improving on a 30-Year LegacyThis video is a recording of a previous webinar entitled: “The New Annual (1985-2023) National Land Cover Database: Improving on a 30-year Legacy.” This webinar was recorded on October 24, 2024 at the USGS EROS.
Read about Annual NLCD and the historical work leading up to it.
USGS Reinvents Widely Used NLCD USGS Reinvents Widely Used NLCD
On your next drive, really look at what covers the landscape: Sprawling housing developments? Crowded skyscrapers? Parking lots? Farm fields? Forests? Rivers? The USGS has led the way in accurately mapping this land cover across the country with the National Land Cover Database (NLCD) for more than two decades. Now NLCD debuts big improvements under a new name: Annual NLCD.
Related
Learn more details about Annual NLCD and its six products.
Annual National Land Cover Database
Land cover is foundational information for land managers, scientists, and the general public. Many types of scientific studies have applied annual land cover information including projecting future land use, documenting forest fragmentation or conservation practices, modeling wildfire hazards, tracking water quality and quantity, and understanding change in wildlife habitat and ecosystem...
Annual National Land Cover Database Frequently Asked Questions
This page lists commonly asked questions (FAQs) pertaining to Annual National Land Cover Database (NLCD).
Eyes on Earth Episode 126 – Annual NLCD
The next generation of USGS land cover mapping is here. Annual NLCD provides land cover data of the U.S. every year back to 1985.
Annual NLCD Characteristics, Constraints, and Caveats
This page provides information about specific artifacts that were discovered in review of Annual National Land Cover Database (NLCD) Collection 1.0 or provided by user feedback. These show up in the products listed below.
Annual NLCD Science Product User Guide
Annual NLCD Collection 1.1 has been released. Collection 1.1 contains 40 years of annual data from 1985 -2024. This document describes the relevant characteristics of the Annual NLCD, Collection 1.1 Science Products to facilitate their use in the land cover remote sensing community.
Annual NLCD Land Cover Confidence
The land cover confidence represents the probability value for the land cover class derived from the classification method.
Annual NLCD Spectral Change Day of Year
The Annual National Land Cover Database (NLCD) Spectral Change Day of Year product represents the day-of-year (DOY) on which a significant deviation in Landsat surface reflectance was detected within the calendar year of the map product. Spectral changes represent abrupt non-phenological changes in the reflectance of the land surface through time that may or may not be related to land cover change...
Annual NLCD Land Cover Classification
The primary NLCD land cover product represents the predominant thematic land cover class within the mapping year with respect to broad categories of artificial or natural surface cover.
Annual NLCD Land Cover Change
The Annual NLCD land cover change product represents annual land cover change between one product year and the next, with those changes represented in the latter year (e.g., differences in land cover between 1985 and 1986 are shown in the 1986 land cover change product). These differences are represented categorically in the product data by concatenating the before and after land cover class codes...
Annual NLCD Impervious Descriptor
The Annual National Land Cover Database (NLCD) Impervious Descriptor product represents categorical data for developed land cover distinguishing roads from urban non-road.
Annual NLCD Fractional Impervious Surface
The Annual National Land Cover Database (NLCD) impervious surface product represents the fractional surface area of the map unit (pixel) that is covered with artificial substrate or structures. This includes processed materials or structures (pavement, concrete, rooftops, and other constructed materials) that generate surface runoff. The majority of these materials are impervious to water, but...
Annual NLCD Product Suite
Annual National Land Cover Database (NLCD) Collection 1.1 includes a suite of six raster land use and land cover science products for the conterminous United States. It covers the period between 1985 and 2024. The Science Product User Guide contains in-depth background and documentation about the Annual NLCD product suite.
About Annual NLCD
Improving information on the characteristics of land cover, understanding the basic drivers of change, and identifying of potential consequences of change on human and natural systems can empower greater insight into the impacts and feedback of human activity and other drivers. To meet its needs, the geospatial community has called for a new generation of monitoring data and information as input...
Listen to an Eyes on Earth podcast and view a webinar about Annual NLCD.
Eyes on Earth Episode 126 – Annual NLCD
In this episode of Eyes on Earth, we talk about the latest release of the National Land Cover Database (NLCD). More than just a map, NLCD is a stack of maps—a database. It has long been the foundational land cover source for scientists, resource managers, and decision-makers across the United States, and now the next generation of USGS land cover mapping is here.
In this episode of Eyes on Earth, we talk about the latest release of the National Land Cover Database (NLCD). More than just a map, NLCD is a stack of maps—a database. It has long been the foundational land cover source for scientists, resource managers, and decision-makers across the United States, and now the next generation of USGS land cover mapping is here.
The New Annual (1985-2023) National Land Cover Database: Improving on a 30-Year Legacy
The New Annual (1985-2023) National Land Cover Database: Improving on a 30-Year LegacyThis video is a recording of a previous webinar entitled: “The New Annual (1985-2023) National Land Cover Database: Improving on a 30-year Legacy.” This webinar was recorded on October 24, 2024 at the USGS EROS.
Read about Annual NLCD and the historical work leading up to it.
USGS Reinvents Widely Used NLCD USGS Reinvents Widely Used NLCD
On your next drive, really look at what covers the landscape: Sprawling housing developments? Crowded skyscrapers? Parking lots? Farm fields? Forests? Rivers? The USGS has led the way in accurately mapping this land cover across the country with the National Land Cover Database (NLCD) for more than two decades. Now NLCD debuts big improvements under a new name: Annual NLCD.