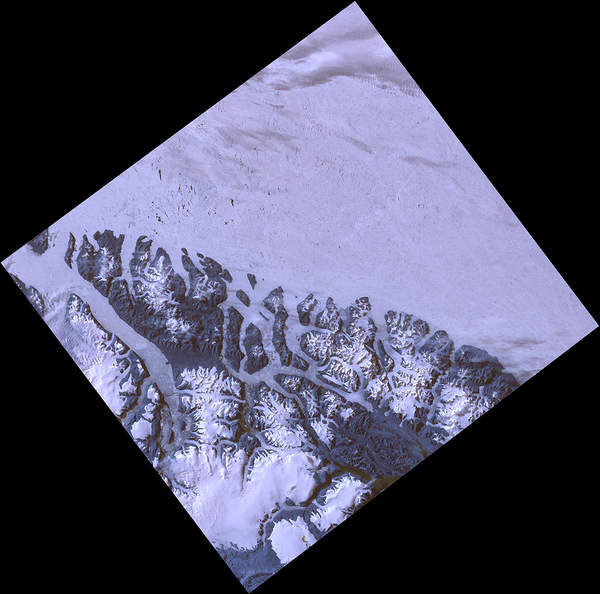
Landsat 8 captured this image of glaciers in Northern Greenland on August 5, 2017.
This image was acquired in response to a Landsat Special Request for the study of glaciers in the Arctic.
Landsat 8
Path 40 Row 245
August 5, 2017

Official websites use .gov
A .gov website belongs to an official government organization in the United States.
Secure .gov websites use HTTPS
A lock () or https:// means you’ve safely connected to the .gov website. Share sensitive information only on official, secure websites.
Explore the images on this page to learn more about the Landsat sensors, satellites and missions.
Landsat 8 captured this image of glaciers in Northern Greenland on August 5, 2017.
This image was acquired in response to a Landsat Special Request for the study of glaciers in the Arctic.
Landsat 8
Path 40 Row 245
August 5, 2017
Landsat 8 captured this image of glaciers in Northern Greenland on August 5, 2017.
This image was acquired in response to a Landsat Special Request for the study of glaciers in the Arctic.
Landsat 8
Path 40 Row 245
August 5, 2017

How many pictures have you taken with your smartphone? Too many to count? However many it is, Landsat 8 probably has you beat. Landsat 8 acquires images at a rate of about 750 per day, and just a little over 4 years after launch in February 2013, the Earth-observing satellite on May 31, 2017, acquired its 1 millionth scene!
How many pictures have you taken with your smartphone? Too many to count? However many it is, Landsat 8 probably has you beat. Landsat 8 acquires images at a rate of about 750 per day, and just a little over 4 years after launch in February 2013, the Earth-observing satellite on May 31, 2017, acquired its 1 millionth scene!

Landsat image of the Providence, RI area showing damage from spongy moth caterpillars (Lymantria dispar). The caterpillars devour the leaves of hardwood trees, causing the greatest damage in late June as the larvae reach maturity. In this natural color Landsat image, the impacted areas show as brown.
Landsat image of the Providence, RI area showing damage from spongy moth caterpillars (Lymantria dispar). The caterpillars devour the leaves of hardwood trees, causing the greatest damage in late June as the larvae reach maturity. In this natural color Landsat image, the impacted areas show as brown.

In the summer of 1988, a wildfire ravaged the world's first national park, consuming 1.2 million acres in and around the Greater Yellowstone Park ecosystem.
In the summer of 1988, a wildfire ravaged the world's first national park, consuming 1.2 million acres in and around the Greater Yellowstone Park ecosystem.

The 122nd Boston Marathon, the oldest annual marathon in the world, takes place on April 16, 2018. This Landsat 8 image shows the April landscape of eastern Massachusetts, before vegetation has greened up. The yellow line indicates the point-to-point route that the marathon follows.
The 122nd Boston Marathon, the oldest annual marathon in the world, takes place on April 16, 2018. This Landsat 8 image shows the April landscape of eastern Massachusetts, before vegetation has greened up. The yellow line indicates the point-to-point route that the marathon follows.

Landsat image of the area near Providence, Rhode Island. This natural color Landsat composite was created using the red, green and blue bands.
Learn more about the Landsat program
Landsat image of the area near Providence, Rhode Island. This natural color Landsat composite was created using the red, green and blue bands.
Learn more about the Landsat program

The biologically complex conditions of mangroves are shown in dark green along the fingers of the Ord River in Australia. Yellow, orange, and blue represent the impressive flow patterns of sediment and nutrients in this tropical estuary. The bright spot at the lower left is an area of mudflats, which is home to saltwater crocodiles.
The biologically complex conditions of mangroves are shown in dark green along the fingers of the Ord River in Australia. Yellow, orange, and blue represent the impressive flow patterns of sediment and nutrients in this tropical estuary. The bright spot at the lower left is an area of mudflats, which is home to saltwater crocodiles.

Canyonlands National Park was one of four national parks established (1964) under the leadership of Interior Secretary Stewart Udall.
Landsat 8, acquired March 29, 2015.
Canyonlands National Park was one of four national parks established (1964) under the leadership of Interior Secretary Stewart Udall.
Landsat 8, acquired March 29, 2015.
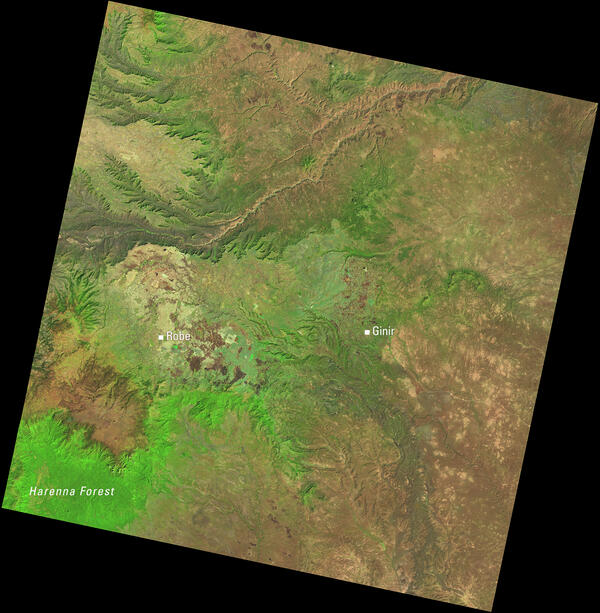
This Landsat 8 image of central Ethiopia, acquired January 1, 2014, uses the shortwave infrared, near infrared, and red spectral bands (bands 6,5,4) to emphasize vegetation and land cover. In this combination, healthy vegetation appears bright green.
This Landsat 8 image of central Ethiopia, acquired January 1, 2014, uses the shortwave infrared, near infrared, and red spectral bands (bands 6,5,4) to emphasize vegetation and land cover. In this combination, healthy vegetation appears bright green.

These cloud patterns cast eerie shadows on the landscape of southern Egypt. The clouds appear red and the desert below hazy blue in this infrared rendition.
These cloud patterns cast eerie shadows on the landscape of southern Egypt. The clouds appear red and the desert below hazy blue in this infrared rendition.

Artist's rendering of Landsat Data Continuity Mission (LDCM). The satellite was renamed Landsat 8 after a successful launch on February 11, 2013.
Visit this Landsat 8 webpage to learn more about the Landsat program.
Artist's rendering of Landsat Data Continuity Mission (LDCM). The satellite was renamed Landsat 8 after a successful launch on February 11, 2013.
Visit this Landsat 8 webpage to learn more about the Landsat program.

This image is a portion of the first Landsat 8 scene acquired May 12, 2013 (Path 107, Rows 70-71) in Western Australia. Geoscience Australia, a Landsat International Cooperator and a Landsat Science Team member, produced this enhanced image. Water and land were masked, separately enhanced, and then reassembled.
This image is a portion of the first Landsat 8 scene acquired May 12, 2013 (Path 107, Rows 70-71) in Western Australia. Geoscience Australia, a Landsat International Cooperator and a Landsat Science Team member, produced this enhanced image. Water and land were masked, separately enhanced, and then reassembled.

Left: Landsat 8 Collection 2 level-1 top of atmosphere reflectance image, center: Landsat 8 Collection 2 level-2 atmospherically corrected surface reflectance image, and right: Landsat 8 Collection 2 level-2 surface temperature image for an area over the Sapta Koshi River in Bairawa, Nepal (path 140 row 41) acquired on
Left: Landsat 8 Collection 2 level-1 top of atmosphere reflectance image, center: Landsat 8 Collection 2 level-2 atmospherically corrected surface reflectance image, and right: Landsat 8 Collection 2 level-2 surface temperature image for an area over the Sapta Koshi River in Bairawa, Nepal (path 140 row 41) acquired on

Example of the Landsat Collection 2 Level-1 and Level-2 sample products from path 140 row 41, acquired on May 3, 2013. Left: Level-1 Top of Atmosphere. Middle: Level-2 Surface Reflectance. Right: Level-2 Surface Temperature.
Example of the Landsat Collection 2 Level-1 and Level-2 sample products from path 140 row 41, acquired on May 3, 2013. Left: Level-1 Top of Atmosphere. Middle: Level-2 Surface Reflectance. Right: Level-2 Surface Temperature.

Left: Landsat 8 Top of Atmosphere reflectance image (bands 4,3,2) and Right: Landsat 8 atmospherically corrected surface reflectance image for an area in Nepal, path 141 row 40 acquired on May 3, 2013.
Left: Landsat 8 Top of Atmosphere reflectance image (bands 4,3,2) and Right: Landsat 8 atmospherically corrected surface reflectance image for an area in Nepal, path 141 row 40 acquired on May 3, 2013.

Example of the Landsat 8 OLI/TIRS Collection 2 level-2 science products. Left: Landsat 8 level-2 surface reflectance image. Right: Landsat 8 level-2 surface temperature image. The data was acquired on May 3, 2013 (path 140 row 41).
Example of the Landsat 8 OLI/TIRS Collection 2 level-2 science products. Left: Landsat 8 level-2 surface reflectance image. Right: Landsat 8 level-2 surface temperature image. The data was acquired on May 3, 2013 (path 140 row 41).

On March 29-30, 2013, the Landsat Data Continuity Mission (later named Landsat 8) was in position under the Landsat 7 satellite. This provided opportunities for near-coincident data collection from both satellites.
On March 29-30, 2013, the Landsat Data Continuity Mission (later named Landsat 8) was in position under the Landsat 7 satellite. This provided opportunities for near-coincident data collection from both satellites.

On March 29-30, 2013, the Landsat Data Continuity Mission (later named Landsat 8) was in position under the Landsat 7 satellite. This provided opportunities for near-coincident data collection from both satellites.
On March 29-30, 2013, the Landsat Data Continuity Mission (later named Landsat 8) was in position under the Landsat 7 satellite. This provided opportunities for near-coincident data collection from both satellites.

On March 29-30, 2013, the Landsat Data Continuity Mission (later named Landsat 8) was in position under the Landsat 7 satellite. This provided opportunities for near-coincident data collection from both satellites.
On March 29-30, 2013, the Landsat Data Continuity Mission (later named Landsat 8) was in position under the Landsat 7 satellite. This provided opportunities for near-coincident data collection from both satellites.

Landsat 8 image from Path 38 Row 35 near Peach Springs, Arizona. The image is shown as a false color composite using the shortwave infrared, near infrared, and red bands (Bands 6|5|4).
Landsat 8 image from Path 38 Row 35 near Peach Springs, Arizona. The image is shown as a false color composite using the shortwave infrared, near infrared, and red bands (Bands 6|5|4).

Landsat 8’s first image captured the area where the Great Plains and Rocky Mountains meet in Colorado in March 2013. The natural-color image shows the coniferous forest of the mountains coming down to the dormant plains. Boulder, Colorado, sits in the middle of the image.
Landsat 8’s first image captured the area where the Great Plains and Rocky Mountains meet in Colorado in March 2013. The natural-color image shows the coniferous forest of the mountains coming down to the dormant plains. Boulder, Colorado, sits in the middle of the image.