
The largest coral reef ecosystem in the world, the Great Barrier Reef (GBR), is threatened by many human-made impacts. Due to the size of the GBR and limited accessibility, mapping and monitoring has always been a challenging task. Remote Sensing is an effective technique that provides valuable information for the GBR ecosystem.
Images
Explore the images on this page to learn more about the Landsat sensors, satellites and missions.
Filter Total Items: 413

HDYL Great Barrier Reef
The largest coral reef ecosystem in the world, the Great Barrier Reef (GBR), is threatened by many human-made impacts. Due to the size of the GBR and limited accessibility, mapping and monitoring has always been a challenging task. Remote Sensing is an effective technique that provides valuable information for the GBR ecosystem.

HDYL Boreal Forest Biome
The boreal forest biome is projected to shift northward due to continued climate change over the coming century. Researchers evaluated early indicators of a boreal forest biome shift using four decades of Landsat observation datasets.
The boreal forest biome is projected to shift northward due to continued climate change over the coming century. Researchers evaluated early indicators of a boreal forest biome shift using four decades of Landsat observation datasets.

Landsat Dashboard.png
Image showing number of Landsat scenes available by location globally over 50 years. Can search by spacecraft identification, sensor identification, year acquired, processing level, and collection category. Maps are interactive and highlight spatial and temporal distribution of the Landsat archive.
Image showing number of Landsat scenes available by location globally over 50 years. Can search by spacecraft identification, sensor identification, year acquired, processing level, and collection category. Maps are interactive and highlight spatial and temporal distribution of the Landsat archive.

LGSOWG #50
The Landsat Ground Station Operators Working Group (LGSOWG) just held its 50th meeting. At the meeting in South Africa, the group
also commemorated the 50th anniversary of the South African National Space Agency Hartebeesthoek ground station.
The Landsat Ground Station Operators Working Group (LGSOWG) just held its 50th meeting. At the meeting in South Africa, the group
also commemorated the 50th anniversary of the South African National Space Agency Hartebeesthoek ground station.

Landsat 7 Satellite Orbit Lowering Illustration
On April 6, 2022, the Landsat 7 ETM+ sensor will be placed into “stand-by” mode as a series of spacecraft burns are performed throughout the month of April to lower the satellite’s orbit by 8 kilometers. This graphic displays how the Landsat 7 spacecraft orbit lowers following each of the spacecraft burns.
On April 6, 2022, the Landsat 7 ETM+ sensor will be placed into “stand-by” mode as a series of spacecraft burns are performed throughout the month of April to lower the satellite’s orbit by 8 kilometers. This graphic displays how the Landsat 7 spacecraft orbit lowers following each of the spacecraft burns.

Landsat 7 First Light Image of Eastern South Dakota
Landsat 7 First Light Image of Eastern South DakotaThis color infrared image of Southeast South Dakota and Northeast Nebraska was advertised as the first image acquired by Landsat 7's Enhanced Thematic Mapper Plus (ETM+) sensor on April 18, 1999.
Landsat 7 First Light Image of Eastern South Dakota
Landsat 7 First Light Image of Eastern South DakotaThis color infrared image of Southeast South Dakota and Northeast Nebraska was advertised as the first image acquired by Landsat 7's Enhanced Thematic Mapper Plus (ETM+) sensor on April 18, 1999.

Landsat Update March 2022
The latest Landsat Update is available for the public. Text on image reads: "Landsat Update: March 2022. Learn the latest Landsat information and news. What's inside? Pecora 22 upcoming meeting, Landsat 9 mission status, Landsat 9 data available, Collection 2 Level 3 products available, Archive reaches 10 million scenes, Landsat Science Team meeting.
The latest Landsat Update is available for the public. Text on image reads: "Landsat Update: March 2022. Learn the latest Landsat information and news. What's inside? Pecora 22 upcoming meeting, Landsat 9 mission status, Landsat 9 data available, Collection 2 Level 3 products available, Archive reaches 10 million scenes, Landsat Science Team meeting.

February Landsat Social Media Posts
Social media posts from February for the March 2022 Landsat Update. Available via Landsat Missions.
Social media posts from February for the March 2022 Landsat Update. Available via Landsat Missions.

Flyer 2 Pecora 2022 Award Call for Nominations
Description of the Pecora Award. This image details the procedure for nominations, eligibility, and privacy statement.
Description of the Pecora Award. This image details the procedure for nominations, eligibility, and privacy statement.

Pecora 2022 Award Call for Nominations
Pecora 2022 award flyer announcing call for nominations. Nominations due April 15, 2022.
Pecora 2022 award flyer announcing call for nominations. Nominations due April 15, 2022.

PECORA award
Pecora 2022 award flyer announcing call for nominations, due April 15, 2022.
Pecora 2022 award flyer announcing call for nominations, due April 15, 2022.

Fire near Uljin-eup, South Korea (Natural Color)
Landsat 9 captured this natural color image of the ongoing fire in Uljin county on South Korea’s west coast.
Landsat 9 captured this natural color image of the ongoing fire in Uljin county on South Korea’s west coast.

Fire near Uljin-eup, South Korea (False Color)
Landsat 9 captured an image of the ongoing fire in Uljin county on South Korea’s west coast. The false color image looks beneath the smoke and shows the burn scar as reddish-brown and the heat signature from the fire as bright red.
Landsat 9 captured an image of the ongoing fire in Uljin county on South Korea’s west coast. The false color image looks beneath the smoke and shows the burn scar as reddish-brown and the heat signature from the fire as bright red.
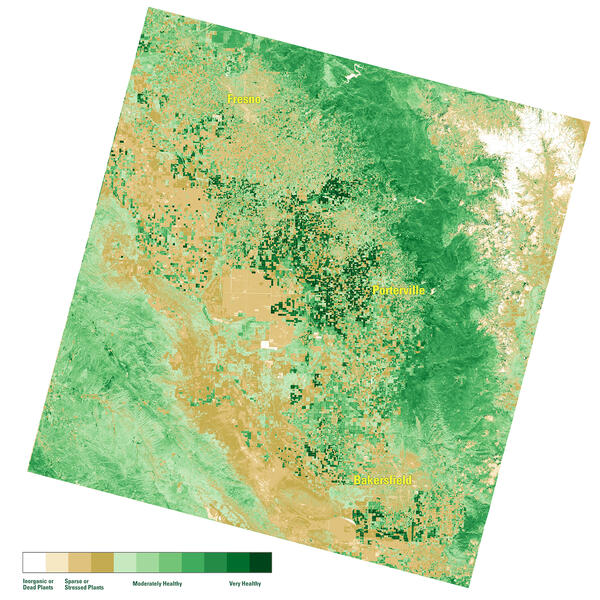
NDVI map of the San Joaquin Valley Region, March 10, 2022
NDVI map of the San Joaquin Valley Region, March 10, 2022A Landsat Surface Reflectance (SR) Normalized Difference Index (NDVI) map of the San Joaquin Valley region of California on March 10, 2022.
NDVI map of the San Joaquin Valley Region, March 10, 2022
NDVI map of the San Joaquin Valley Region, March 10, 2022A Landsat Surface Reflectance (SR) Normalized Difference Index (NDVI) map of the San Joaquin Valley region of California on March 10, 2022.
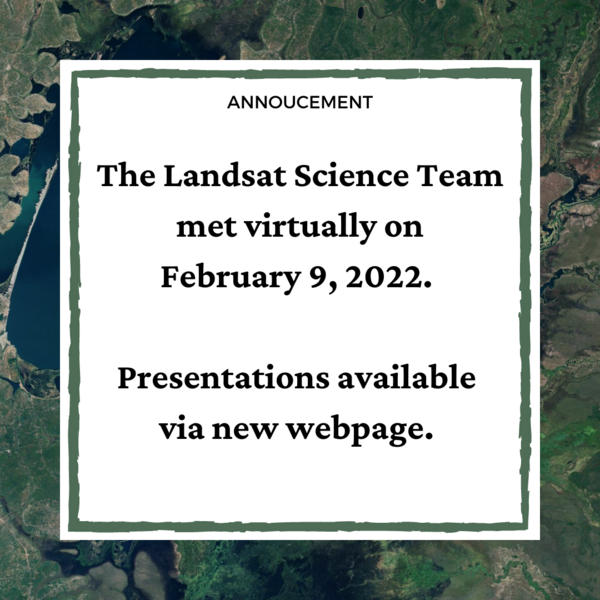
Landsat Science Team Meeting Presentations Available
Landsat Science Team Meeting Presentations AvailableThe Landsat Science Team met virtually on February 9, 2022. Topics included, but were not limited to, Landsat 9 operations, calibration, and data release plans; Landsat 7 mission status; Landsat and Sentinel harmonization; and the future of land imaging.
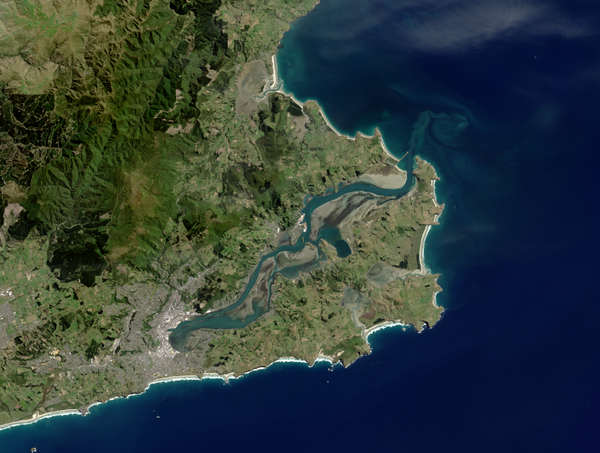
Landsat 9 Image of Otago Harbor New Zealand
This Landsat 9 image shows a portion of the Otago Harbor area that is situated on the southeastern coastline of New Zealand's South Island.
The city of Dunedin can be seen at the the head of the harbor.
This image was acquired March 2, 2022.
Path 74 Row 92
This Landsat 9 image shows a portion of the Otago Harbor area that is situated on the southeastern coastline of New Zealand's South Island.
The city of Dunedin can be seen at the the head of the harbor.
This image was acquired March 2, 2022.
Path 74 Row 92

Using Satellite-derived Maps in Rangeland Management
Using Satellite-derived Maps in Rangeland ManagementRangeland management has used Landsat imagery for 50 years. Satellite imagery can provide a more comprehensive view of native pastures and prairies that cover swaths of Western America.
A new paper in Elsevier provides four guiding principles for ranges:
1. Use maps within a decision-making framework

Landsat 9 image of Bangladesh Coast
Landsat 9 natural color image (Bands 4, 3, 2) of the Bangladesh coastline on the Bay of Bengal acquired on February 8, 2022. The Sundarbans mangrove forest, a protected UNESCO area, appears as dark green on the left side of the image. The right side of the image shows agricultural lands and urban areas as light tan and gray.
Landsat 9 natural color image (Bands 4, 3, 2) of the Bangladesh coastline on the Bay of Bengal acquired on February 8, 2022. The Sundarbans mangrove forest, a protected UNESCO area, appears as dark green on the left side of the image. The right side of the image shows agricultural lands and urban areas as light tan and gray.

Landsat 9 image of St. Petersburg and Tampa, Florida area
Landsat 9 image of St. Petersburg and Tampa, Florida areaFalse color image of Landsat 9 image of the St. Petersburg and Tampa, Florida area as seen by Landsat 9 on January 30, 2022. Between Landsat 8 and Landsat 9, the Landsat program delivers complete coverage of the Earth’s surface every eight days.
Landsat Scene ID LC09_L1TP_017041_20220130_20220130_02_T1

Landsat 9 image of San Francisco Bay, California
This natural color Landsat 9 image from December 10, 2021 shows the cities of San Francisco, San Jose, and Oakland surrounding the San Francisco Bay. The bay is the largest estuary on the west coast and includes a patchwork of mud flats, salt marshes, and salt ponds.
This natural color Landsat 9 image from December 10, 2021 shows the cities of San Francisco, San Jose, and Oakland surrounding the San Francisco Bay. The bay is the largest estuary on the west coast and includes a patchwork of mud flats, salt marshes, and salt ponds.

Pecora Abstract & Special Session Deadline Extended
Pecora Abstract & Special Session Deadline ExtendedThe deadline for Special Sessions and Abstracts has been extended to March 15, 2022.
Pecora Abstract & Special Session Deadline Extended
Pecora Abstract & Special Session Deadline ExtendedThe deadline for Special Sessions and Abstracts has been extended to March 15, 2022.