
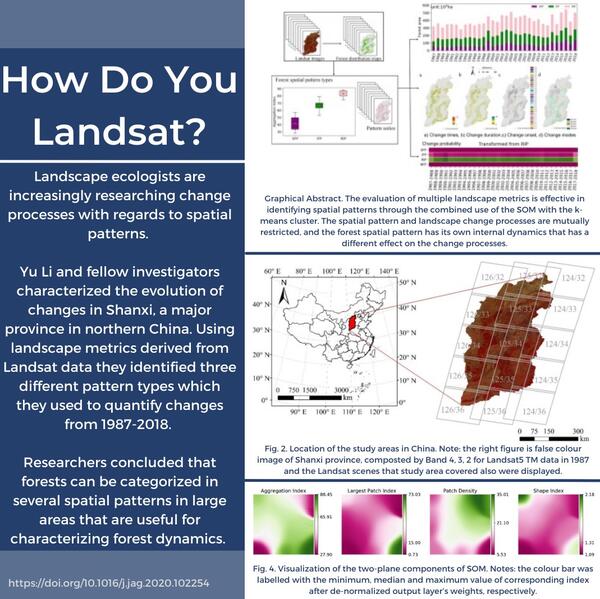
Landscape ecologists are increasingly researching change processes with regards to spatial patterns.
Images
Explore the images on this page to learn more about the Landsat sensors, satellites and missions.
Filter Total Items: 413
How Do You Landsat with Chinese Forests.png
Landscape ecologists are increasingly researching change processes with regards to spatial patterns.

Landsat 9 Image of Western Guinea-Bissau
The Geba River on the west coast of Guinea-Bissau is seen in this natural color Landsat 9 image from February 8, 2022. Silt carried by the river into the Atlantic Ocean creates intricate patterns as it moves around the Bissagos (or Bijagós) Islands. The country’s capital, Bissau, can be seen on the north side of the estuary and appears as light brown.
The Geba River on the west coast of Guinea-Bissau is seen in this natural color Landsat 9 image from February 8, 2022. Silt carried by the river into the Atlantic Ocean creates intricate patterns as it moves around the Bissagos (or Bijagós) Islands. The country’s capital, Bissau, can be seen on the north side of the estuary and appears as light brown.

Landsat Collection 2 Fractional Snow Covered Area (fSCA) Grid Map
Landsat Collection 2 Fractional Snow Covered Area (fSCA) Grid MapThis map shows where Landsat Collection 2 fractional Snow Covered Area (fSCA) and Canopy Adjusted fSCA data is available for the conterminous United States (top) and Alaska (below). To learn more visit the Landsat Collection 2 fSCA science products web page.

Landsat 9 image of Abaco Island, The Bahamas
Natural color image of Abaco Islands, the Bahamas, as seen by Landsat 9 on January 18, 2022. Between Landsat 8 and Landsat 9, the Landsat program delivers complete coverage of the Earth’s surface every eight days.
Landsat Scene ID LC09_L1TP_013042_20220118_20220118_02_T1
Natural color image of Abaco Islands, the Bahamas, as seen by Landsat 9 on January 18, 2022. Between Landsat 8 and Landsat 9, the Landsat program delivers complete coverage of the Earth’s surface every eight days.
Landsat Scene ID LC09_L1TP_013042_20220118_20220118_02_T1

LIMA Image
In the International Polar Year 2007-2008, Landsat 7 brought the coldest continent to life with high resolution satellite imagery.
In the International Polar Year 2007-2008, Landsat 7 brought the coldest continent to life with high resolution satellite imagery.

How Do You Landsat from a Delta in China
With rapidly rising sea levels and drastically declining river discharge, the Changjiang Delta, near Shanghai, China, is continually evolving. Using Landsat imagery, researchers focused on tidal level fluctuations to help understand the changes to the largest uninhabited island in the estuary, Jiuduansha island.
With rapidly rising sea levels and drastically declining river discharge, the Changjiang Delta, near Shanghai, China, is continually evolving. Using Landsat imagery, researchers focused on tidal level fluctuations to help understand the changes to the largest uninhabited island in the estuary, Jiuduansha island.

Latest for Landsat
Landsat Updates are prepared periodically and distributed electronically to provide information about Landsat activities and related topics of interest.
Read more here: https://www.usgs.gov/landsat-missions/news/landsat-update-special-issue…
Landsat Updates are prepared periodically and distributed electronically to provide information about Landsat activities and related topics of interest.
Read more here: https://www.usgs.gov/landsat-missions/news/landsat-update-special-issue…


How Do You Landsat in the Brazil Cerrado
The South American Savannas host several species, including ocelots and nutria rats. The soil is rich soil results in plantations of bananas, coffee, and other crops. Areas are cleared out for the fertile humus. The tropical Brazilian Cerrado is the largest savanna on the continent and the most threated biome from agricultural expansion.
The South American Savannas host several species, including ocelots and nutria rats. The soil is rich soil results in plantations of bananas, coffee, and other crops. Areas are cleared out for the fertile humus. The tropical Brazilian Cerrado is the largest savanna on the continent and the most threated biome from agricultural expansion.

The Svalbard (SGS) Ground Station for the Landsat Program
The Svalbard (SGS) Ground Station for the Landsat ProgramThe Svalbard (SGS) ground station is located at the SvalSat facility in Svalbard, Norway. SGS supports both the Landsat 8 and Landsat 9 missions.
The Svalbard (SGS) Ground Station for the Landsat Program
The Svalbard (SGS) Ground Station for the Landsat ProgramThe Svalbard (SGS) ground station is located at the SvalSat facility in Svalbard, Norway. SGS supports both the Landsat 8 and Landsat 9 missions.

National Land Cover Database of the Cape Cod Region
National Land Cover Database of the Cape Cod RegionThis map of the Cape Cod region is created with the National Land Cover Dataset (NLCD). The dataset classifies land cover into categories such as developed areas, forests, wetlands, and water bodies, providing a detailed view of the region's composition.
USGS Earth Resources Observation and Science (EROS) Center
USGS Earth Resources Observation and Science (EROS) CenterThe Landsat Ground Station (LGS) is located at the U.S. Geological Survey (USGS) Earth Resources Observation and Science (EROS) Center in Sioux Falls, South Dakota. LGS supports all Landsat missions.

Landsat 8 Image of Lake Tahoe
The Operational Land Imager (OLI) onboard Landsat 8 captured this image of Lake Tahoe.
The Operational Land Imager (OLI) onboard Landsat 8 captured this image of Lake Tahoe.

Landsat 9 image of Northern Madagascar
The Betsiboka River in Northern Madagascar is seen in this Landsat 9 natural color image from December 7, 2021. Extensive logging has left the land vulnerable, and iron rich soils are washed into the river, coloring it a reddish orange as it flows to the Betsiboka estuary delta.
Product ID LC09_L1TP_160071_20211207_20220120_02_T1

Landsat Science Team Meeting Virtually Held
NASA and the USGS briefed the Landsat Science Team about Landsat 9 at their Fall Meeting held virtually on November 24, 2021.
Read the details here: https://www.usgs.gov/landsat-missions/news/landsat-science-team-virtual…
NASA and the USGS briefed the Landsat Science Team about Landsat 9 at their Fall Meeting held virtually on November 24, 2021.
Read the details here: https://www.usgs.gov/landsat-missions/news/landsat-science-team-virtual…

Human or natural? Landscape context improves the attribution of forest disturbances mapped from Landsat in Central Europe
Human or natural? Landscape context improves the attribution of forest disturbances mapped from Landsat in Central EuropeDeforestation can happen naturally, through infestation of native beetles and extreme weather. However, people can intentionally clear forests for timber and other industries. Difference between the two can be difficult to diagnose.

Landsat Mission Website Changes
On Tuesday December 7, 2021, updates were made to all USGS webpages, including the Landsat Missions Web Site (LMWS).
Learn more here: https://www.usgs.gov/landsat-missions/news/landsat-mission-web-site-cha…
On Tuesday December 7, 2021, updates were made to all USGS webpages, including the Landsat Missions Web Site (LMWS).
Learn more here: https://www.usgs.gov/landsat-missions/news/landsat-mission-web-site-cha…

Mapping tree height distributions in Sub-Saharan Africa using Landsat 7 and 8 data
Mapping tree height distributions in Sub-Saharan Africa using Landsat 7 and 8 data

10 Millionth Landsat Image
On November 23, 2021, the Landsat Archive added its ten millionth image. The Landsat 7 scene was acquired over the Dead Sea and is shown as a false color image using the short-wave infrared, near infrared and red bands (bands 5,4,3).
On November 23, 2021, the Landsat Archive added its ten millionth image. The Landsat 7 scene was acquired over the Dead Sea and is shown as a false color image using the short-wave infrared, near infrared and red bands (bands 5,4,3).

Queensland Australia Landsat 8-Landsat 9 Underfly Images
Queensland Australia Landsat 8-Landsat 9 Underfly ImagesThese images of an area in south central Queensland, Australia were acquired by the instruments onboard both Landsat 8 and Landsat 9 on November 15, 2021, as Landsat 9 flew beneath Landsat 8 as the satellite continued its climb to nominal orbital altitude.

Landsat 9 Underfly with Landsat 8 over Puerto Vallarta, Mexico
Landsat 9 Underfly with Landsat 8 over Puerto Vallarta, MexicoImages from the Landsat 9 underfly with Landsat 8 over Puerto Vallarta, Mexico on November 11, 2021. The left image shows the Landsat 8 OLI image and the right image is from Landsat 9 OLI. Both images are shown as a true color image using the red, green, and blue bands (Bands 4,3,2).