Landsat 8 image acquired on November 11, 2020 over southwest Morocco (Path 203 Row 40). The image is shown using the shortwave infrared 2, red, and blue bands (bands 7,4,2).
Landsat Scene ID LO08_L1TP_203040_20201107_20201111_01_T1


Official websites use .gov
A .gov website belongs to an official government organization in the United States.

Secure .gov websites use HTTPS
A lock () or https:// means you’ve safely connected to the .gov website. Share sensitive information only on official, secure websites.

Explore the images on this page to learn more about the Landsat sensors, satellites and missions.

Landsat 8 image acquired on November 11, 2020 over southwest Morocco (Path 203 Row 40). The image is shown using the shortwave infrared 2, red, and blue bands (bands 7,4,2).
Landsat Scene ID LO08_L1TP_203040_20201107_20201111_01_T1
Landsat 8 image acquired on November 11, 2020 over southwest Morocco (Path 203 Row 40). The image is shown using the shortwave infrared 2, red, and blue bands (bands 7,4,2).
Landsat Scene ID LO08_L1TP_203040_20201107_20201111_01_T1

Featured Landsat Image: Qaidam Basin, China. Landsat 8 image from Path 139 Row 034 acquired on Date 22 October 2020. Shown as a pan-sharpened (Band 8) natural color image using the red, green and blue bands (Bands 4, 3, 2)
Featured Landsat Image: Qaidam Basin, China. Landsat 8 image from Path 139 Row 034 acquired on Date 22 October 2020. Shown as a pan-sharpened (Band 8) natural color image using the red, green and blue bands (Bands 4, 3, 2)
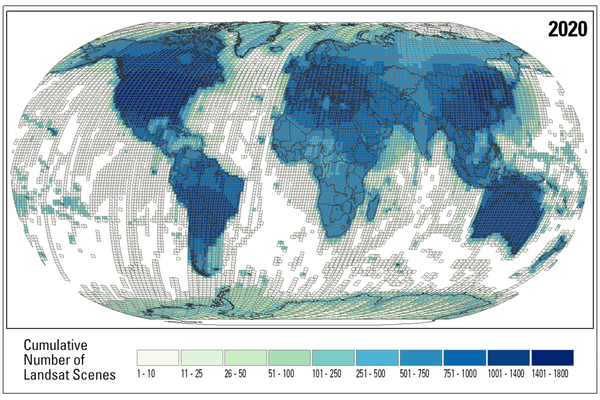
This graphic shows the cumulative number of scenes by path and row in the Landsat archive from 1972 - 2020. This graphic was created on the anniversary of the 9 millionth scene addition to the USGS Landsat Archive.
This graphic shows the cumulative number of scenes by path and row in the Landsat archive from 1972 - 2020. This graphic was created on the anniversary of the 9 millionth scene addition to the USGS Landsat Archive.

The USGS Landsat Archive added its 9 millionth scene to the archive on September 18, 2020. The scene was acquired by Landsat 8 over Northern Paraguay and is shown using bands 6,5,4.
The USGS Landsat Archive added its 9 millionth scene to the archive on September 18, 2020. The scene was acquired by Landsat 8 over Northern Paraguay and is shown using bands 6,5,4.

Landsat 8 image on the Utah-Arizona Border on the Navajo Nation acquired on September 18, 2020.
For more information about Landsat, please visit www.usgs.gov/Landsat
To download the data, visit earthexplorer.usgs.gov
Landsat 8 image on the Utah-Arizona Border on the Navajo Nation acquired on September 18, 2020.
For more information about Landsat, please visit www.usgs.gov/Landsat
To download the data, visit earthexplorer.usgs.gov

Example of the Landsat 7 ETM+ Collection 2 level-2 science products. Left: Landsat 7 level-2 surface reflectance image. Right: Landsat 7 level-2 surface temperature image. The data was acquired on August 19, 2020 (path 179 row 28).
Example of the Landsat 7 ETM+ Collection 2 level-2 science products. Left: Landsat 7 level-2 surface reflectance image. Right: Landsat 7 level-2 surface temperature image. The data was acquired on August 19, 2020 (path 179 row 28).

Example of the Landsat 8 OLI/TIRS Collection 2 level-1 product. This Landsat 8 image was acquired on August 18, 2020 over Lake Everard and Lake Harry in southern Australia and is shown as a false color composite using the shortwave infrared, near infrared, and red bands (bands 6,5,4).
Example of the Landsat 8 OLI/TIRS Collection 2 level-1 product. This Landsat 8 image was acquired on August 18, 2020 over Lake Everard and Lake Harry in southern Australia and is shown as a false color composite using the shortwave infrared, near infrared, and red bands (bands 6,5,4).
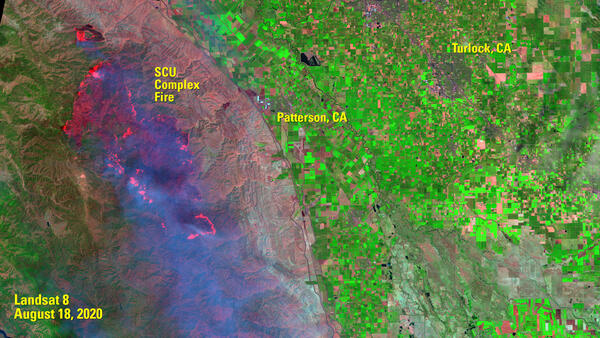
Landsat 8 image of 2020 SCU Complex Fire in California.
Landsat 8 image of 2020 SCU Complex Fire in California.

On August 10, 2018, Operational Land Imager (OLI) on Landsat 8 acquired this image showing part of the Stillwater Complex south of Nye, Montana. Read the original story on NASA Earth Observatory.
On August 10, 2018, Operational Land Imager (OLI) on Landsat 8 acquired this image showing part of the Stillwater Complex south of Nye, Montana. Read the original story on NASA Earth Observatory.

Left: Land surface reflectance natural color composite image (bands 4,3,2); Right: aquatic reflectance Band 2 (Blue band) image of San Francisco Bay, using data acquired by Landsat 8 (Path 44 Row 33) on October 7, 2018
Left: Land surface reflectance natural color composite image (bands 4,3,2); Right: aquatic reflectance Band 2 (Blue band) image of San Francisco Bay, using data acquired by Landsat 8 (Path 44 Row 33) on October 7, 2018

William T. Pecora, Director of the USGS from 1965 to 1971, is largely responsible for two major contributions to science in the public interest: the creation of a national earthquake research center at the USGS facility in Menlo Park, CA, and the Landsat series of Earth observing satellites.
William T. Pecora, Director of the USGS from 1965 to 1971, is largely responsible for two major contributions to science in the public interest: the creation of a national earthquake research center at the USGS facility in Menlo Park, CA, and the Landsat series of Earth observing satellites.

This image shows a false color (bands 7,6,5) nighttime Landsat 8 image of the Taal Volcano overlaid on a daytime Landsat panchromatic black and white image (band 8). The nighttime image from path 220/row194 was acquired on January 15, 2020, a few days after the volcano's eruption.
This image shows a false color (bands 7,6,5) nighttime Landsat 8 image of the Taal Volcano overlaid on a daytime Landsat panchromatic black and white image (band 8). The nighttime image from path 220/row194 was acquired on January 15, 2020, a few days after the volcano's eruption.

Landsat 8 image of Phoenix, Arizona, acquired on January 13, 2020 (Path 37 Row 36). This false color image uses the short-wave infrared, near infrared, and red bands (bands 6, 5, 4) to display the data.
For more information about Landsat, please visit www.usgs.gov/Landsat
Landsat 8 image of Phoenix, Arizona, acquired on January 13, 2020 (Path 37 Row 36). This false color image uses the short-wave infrared, near infrared, and red bands (bands 6, 5, 4) to display the data.
For more information about Landsat, please visit www.usgs.gov/Landsat
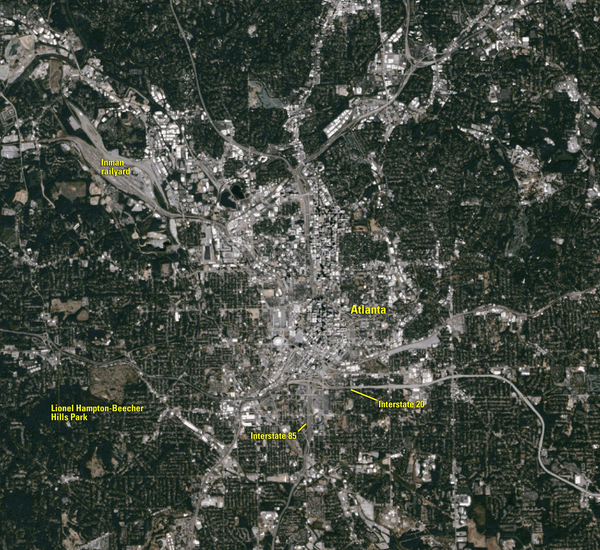
Animation comparing a natural color Landsat 8 satellite image of Atlanta, GA with satellite-based surface temperatures. Buildings and impervious surfaces trap heat, leading to higher temperatures in urban areas - a phenomenon generally referred to as the Urban Heat Island effect.
Animation comparing a natural color Landsat 8 satellite image of Atlanta, GA with satellite-based surface temperatures. Buildings and impervious surfaces trap heat, leading to higher temperatures in urban areas - a phenomenon generally referred to as the Urban Heat Island effect.

This map displays Landsat 7 scenes not acquired Dec 17, 2019, due to a choke anamoly on the ETM+ sensor's solid state recorder.
Visit the Landsat Headlines for more information about this event.
This map displays Landsat 7 scenes not acquired Dec 17, 2019, due to a choke anamoly on the ETM+ sensor's solid state recorder.
Visit the Landsat Headlines for more information about this event.

Landsat 8 image of Manila Bay, captured on December 6, 2019, four days after the area was struck by Typhoon Kammuri.
Landsat 8 image of Manila Bay, captured on December 6, 2019, four days after the area was struck by Typhoon Kammuri.

The United Kingdom’s Solway Firth is show in these images comparing a natural color Landsat 8 Collection 2 Level-1 product (Bands 4,3,2) acquired on October 2, 2019 (left), and the corresponding Collection 2 Provisional Aquatic Reflectance science product using Rayleigh-corrected Reflectance (RHORC) Bands 4,3,2 (right).
The United Kingdom’s Solway Firth is show in these images comparing a natural color Landsat 8 Collection 2 Level-1 product (Bands 4,3,2) acquired on October 2, 2019 (left), and the corresponding Collection 2 Provisional Aquatic Reflectance science product using Rayleigh-corrected Reflectance (RHORC) Bands 4,3,2 (right).

Star dunes, colored red by iron oxide sand, are seen in this Landsat scene from Sossusvlei in Namibia.
Star dunes, colored red by iron oxide sand, are seen in this Landsat scene from Sossusvlei in Namibia.

Meltwater lakes form on the surface of Greenland’s Petermann Glacier, seen here in a June 2019 Landsat image. A new study finds that the number, and elevation, of meltwater lakes in Greenalnd is increasing. Credit: NASA/USGS
Meltwater lakes form on the surface of Greenland’s Petermann Glacier, seen here in a June 2019 Landsat image. A new study finds that the number, and elevation, of meltwater lakes in Greenalnd is increasing. Credit: NASA/USGS
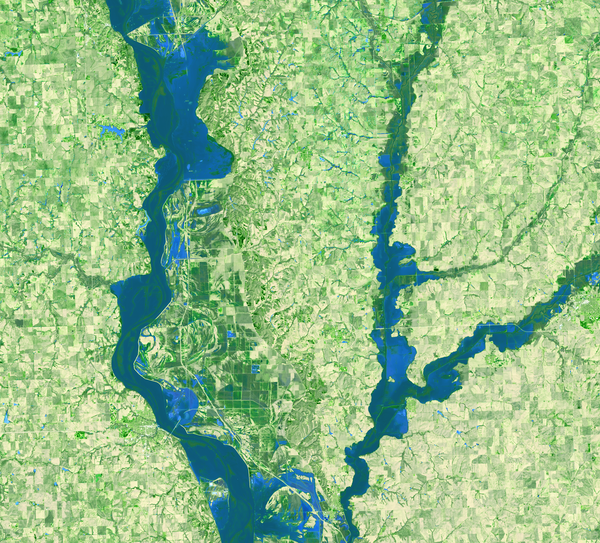
In March 2019, a warm spell that contained heavy rainfall caused snow covering the landscape (up to 3 feet in some areas) to quickly melt, and caused major flooding in the U.S. Midwest. Overall, the "The Great Flood of 2019" greatly affected the Missouri River and its tributaries in South Dakota, Iowa, Nebraska, Missouri, and Kansas.
In March 2019, a warm spell that contained heavy rainfall caused snow covering the landscape (up to 3 feet in some areas) to quickly melt, and caused major flooding in the U.S. Midwest. Overall, the "The Great Flood of 2019" greatly affected the Missouri River and its tributaries in South Dakota, Iowa, Nebraska, Missouri, and Kansas.
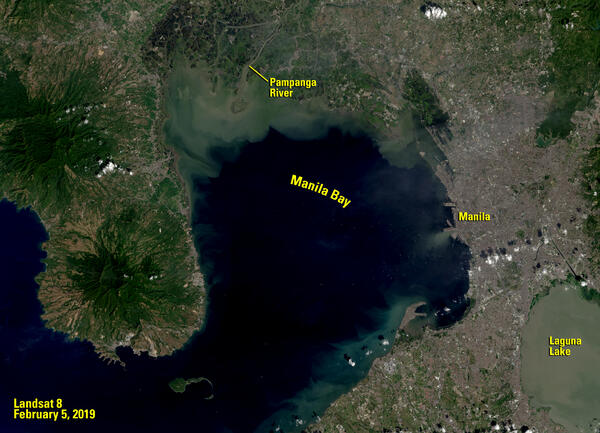
Landsat 8 image of Manila Bay, captured on February 5, 2019
Landsat 8 image of Manila Bay, captured on February 5, 2019