Located just southeast of Osborne, Kansas, is the Geodetic Center of North America. The Geodetic Center is the initial point upon which all North American surveys, deeds, and maps are based.
Capital Topeka
Image Source Landsat 8
Population 2,937,880


Official websites use .gov
A .gov website belongs to an official government organization in the United States.

Secure .gov websites use HTTPS
A lock () or https:// means you’ve safely connected to the .gov website. Share sensitive information only on official, secure websites.

Core Science Systems images.

Located just southeast of Osborne, Kansas, is the Geodetic Center of North America. The Geodetic Center is the initial point upon which all North American surveys, deeds, and maps are based.
Capital Topeka
Image Source Landsat 8
Population 2,937,880
Located just southeast of Osborne, Kansas, is the Geodetic Center of North America. The Geodetic Center is the initial point upon which all North American surveys, deeds, and maps are based.
Capital Topeka
Image Source Landsat 8
Population 2,937,880

The highest and lowest points in the continental United States are located within 100 miles of each other in California: Mount Whitney (14,494 feet) and Death Valley (282 feet below sea level).
Capital Sacramento
Image Source Landsat 8
Population 39,538,223
The highest and lowest points in the continental United States are located within 100 miles of each other in California: Mount Whitney (14,494 feet) and Death Valley (282 feet below sea level).
Capital Sacramento
Image Source Landsat 8
Population 39,538,223

Denver, the capital of Colorado, is known as the “Mile High City.” The thirteenth step of the capitol building is exactly one mile (5,280 feet) above sea level.
Capital Denver
Image Source Landsat 8
Population 5,773,714
Number of Pixels 299,555,595
Denver, the capital of Colorado, is known as the “Mile High City.” The thirteenth step of the capitol building is exactly one mile (5,280 feet) above sea level.
Capital Denver
Image Source Landsat 8
Population 5,773,714
Number of Pixels 299,555,595

Delaware is known as the “First State,” because it was the first of the original thirteen colonies to ratify the United States Constitution.
Capital Dover
Image Source Landsat 8
Population 989,948
Number of Pixels 5,788,036
Delaware is known as the “First State,” because it was the first of the original thirteen colonies to ratify the United States Constitution.
Capital Dover
Image Source Landsat 8
Population 989,948
Number of Pixels 5,788,036

Before Abraham Lincoln was elected President, he served in the Illinois legislature and practiced law in Springfield. Lincoln is buried just outside Springfield at the Lincoln Tomb State Historic Site.
Capital Springfield
Image Source Landsat 8
Population 12,812,508
Before Abraham Lincoln was elected President, he served in the Illinois legislature and practiced law in Springfield. Lincoln is buried just outside Springfield at the Lincoln Tomb State Historic Site.
Capital Springfield
Image Source Landsat 8
Population 12,812,508

Mammoth Cave, Kentucky is the world’s longest cave system, with more than 400 miles explored. Tours of Mammoth Cave have been given since 1816.
Capital Frankfort
Image Source Landsat 8
Population 4,505,836
Number of Pixels 116,287,675
Mammoth Cave, Kentucky is the world’s longest cave system, with more than 400 miles explored. Tours of Mammoth Cave have been given since 1816.
Capital Frankfort
Image Source Landsat 8
Population 4,505,836
Number of Pixels 116,287,675

Louisiana is the only state with a large population of Cajuns, descendants of the Acadians who were driven out of Canada in the 1700s because they would not pledge allegiance to the King of England.
Capital Baton Rouge
Image Source Landsat 8
Population 4,657,757
Louisiana is the only state with a large population of Cajuns, descendants of the Acadians who were driven out of Canada in the 1700s because they would not pledge allegiance to the King of England.
Capital Baton Rouge
Image Source Landsat 8
Population 4,657,757

Forests cover approximately 2.6 million acres, or 41 percent, of Maryland’s land surface. Oak and hickory are the dominant hardwood or deciduous forest types, and loblolly pine is the most prevalent softwood.
Capital Annapolis
Image Source Landsat 8
Population 6,177,224
Forests cover approximately 2.6 million acres, or 41 percent, of Maryland’s land surface. Oak and hickory are the dominant hardwood or deciduous forest types, and loblolly pine is the most prevalent softwood.
Capital Annapolis
Image Source Landsat 8
Population 6,177,224

The Mackinac Bridge is one of the longest suspension bridges in the world. It connects the upper and lower peninsulas of Michigan and spans five miles over the Straits of Mackinac, where Lake Michigan and Lake Huron meet.
Capital Lansing
Image Source Landsat 8
The Mackinac Bridge is one of the longest suspension bridges in the world. It connects the upper and lower peninsulas of Michigan and spans five miles over the Straits of Mackinac, where Lake Michigan and Lake Huron meet.
Capital Lansing
Image Source Landsat 8

Minnesota has more shoreline than California, Florida, and Hawaii combined. It is sometimes called the “Land of 10,000 Lakes,” but it actually has 12,000 lakes, three-fourths of which are four hectares (10 acres) or more in size.
Capital St. Paul
Image Source Landsat 8
Minnesota has more shoreline than California, Florida, and Hawaii combined. It is sometimes called the “Land of 10,000 Lakes,” but it actually has 12,000 lakes, three-fourths of which are four hectares (10 acres) or more in size.
Capital St. Paul
Image Source Landsat 8

The largest earthquake ever recorded in the continental United States occurred near New Madrid, Missouri, in 1812. The quake shook more than one million square miles and was felt as far as 1,000 miles away.
Capital Jefferson City
Image Source Landsat 8
Population 6,154,913
The largest earthquake ever recorded in the continental United States occurred near New Madrid, Missouri, in 1812. The quake shook more than one million square miles and was felt as far as 1,000 miles away.
Capital Jefferson City
Image Source Landsat 8
Population 6,154,913
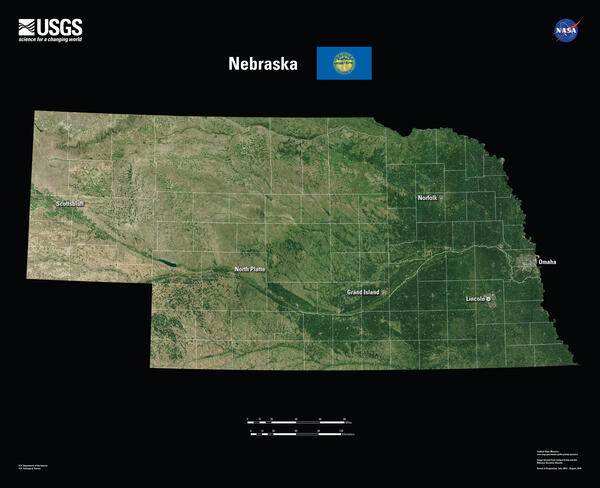
Although once described as the “Great American Desert,” Nebraska is now a breadbasket for the nation and much of the world. It ranks among the leading states in many agricultural production categories.
Capital Lincoln
Image Source Landsat 8
Population 1,961,504
Although once described as the “Great American Desert,” Nebraska is now a breadbasket for the nation and much of the world. It ranks among the leading states in many agricultural production categories.
Capital Lincoln
Image Source Landsat 8
Population 1,961,504

Orville and Wilbur Wright made the first powered flight near Kitty Hawk, North Carolina in 1903. The actual flight took place four miles away at the Kill Devil Hills, now the site of Wright Brothers National Memorial.
Capital Raleigh
Image Source Landsat 8
Orville and Wilbur Wright made the first powered flight near Kitty Hawk, North Carolina in 1903. The actual flight took place four miles away at the Kill Devil Hills, now the site of Wright Brothers National Memorial.
Capital Raleigh
Image Source Landsat 8

Since 1931, Rugby, North Dakota, has been recognized as the geographical center of North America. A 15-foot tall rock obelisk, flanked by poles flying the United States and Canadian flags, marks the location.
Capital Bismarck
Image Source Landsat 8
Population 779,094
Since 1931, Rugby, North Dakota, has been recognized as the geographical center of North America. A 15-foot tall rock obelisk, flanked by poles flying the United States and Canadian flags, marks the location.
Capital Bismarck
Image Source Landsat 8
Population 779,094

Fort Sumter National Monument in Charleston harbor marks the site of the first hostilities of the Civil War in April, 1861.
Capital Columbia
Image Source Landsat 8
Population 5,118,425
Number of Pixels 89,542,287
Fort Sumter National Monument in Charleston harbor marks the site of the first hostilities of the Civil War in April, 1861.
Capital Columbia
Image Source Landsat 8
Population 5,118,425
Number of Pixels 89,542,287

Tennessee has had several nicknames, but the most popular is the “Volunteer State.” The nickname originated during the War of 1812 when volunteer soldiers from Tennessee displayed marked valor in the Battle of New Orleans.
Capital Nashville
Image Source Landsat 8
Tennessee has had several nicknames, but the most popular is the “Volunteer State.” The nickname originated during the War of 1812 when volunteer soldiers from Tennessee displayed marked valor in the Battle of New Orleans.
Capital Nashville
Image Source Landsat 8

Sometimes called the “Mother State,” Virginia has produced eight U.S. presidents (more than any other state): George Washington, Thomas Jefferson, James Madison, James Monroe, William Harrison, John Tyler, Zachary Taylor, and Woodrow Wilson.
Capital Richmond
Image Source Landsat 8
Sometimes called the “Mother State,” Virginia has produced eight U.S. presidents (more than any other state): George Washington, Thomas Jefferson, James Madison, James Monroe, William Harrison, John Tyler, Zachary Taylor, and Woodrow Wilson.
Capital Richmond
Image Source Landsat 8

Mount St. Helens in southeast Washington erupted on May 18, 1980. The volcano and 110,000 acres of surrounding land are now part of the Mount St. Helens National Volcanic Monument.
Capital Olympia
Image Source Landsat 8
Population 7,705,281
Mount St. Helens in southeast Washington erupted on May 18, 1980. The volcano and 110,000 acres of surrounding land are now part of the Mount St. Helens National Volcanic Monument.
Capital Olympia
Image Source Landsat 8
Population 7,705,281

Graphic copy of a USGS-generated Brazos River inundation map.
Graphic copy of a USGS-generated Brazos River inundation map.

This is a geiger mode lidar image colored by elevation over Cook County, Illinois
This is a geiger mode lidar image colored by elevation over Cook County, Illinois

Lidar point cloud image of USGS headquarters building in Reston, VA, shaded by elevation
Lidar point cloud image of USGS headquarters building in Reston, VA, shaded by elevation