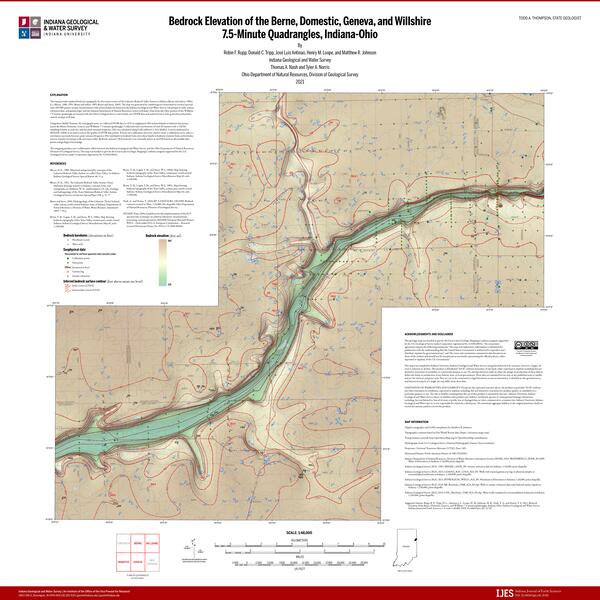
U.S. flag

An official website of the United States government

Images

Core Science Systems images.

Filter Total Items: 657
Landsat Missions Website Changes
Landsat Mission Website Changes

On Tuesday December 7, 2021, updates were made to all USGS webpages, including the Landsat Missions Web Site (LMWS). 

Learn more here: https://www.usgs.gov/landsat-missions/news/landsat-mission-web-site-cha…

10 Millionth Landsat Image

On November 23, 2021, the Landsat Archive added its ten millionth image. The Landsat 7 scene was acquired over the Dead Sea and is shown as a false color image using the short-wave infrared, near infrared and red bands (bands 5,4,3).

On November 23, 2021, the Landsat Archive added its ten millionth image. The Landsat 7 scene was acquired over the Dead Sea and is shown as a false color image using the short-wave infrared, near infrared and red bands (bands 5,4,3).

Landsat 8 and Landsat 9 images of an area of Queensland, Australia acquired during the satellite's underfly event
Queensland Australia Landsat 8-Landsat 9 Underfly Images

These images of an area in south central Queensland, Australia were acquired by the instruments onboard both Landsat 8 and Landsat 9 on November 15, 2021, as Landsat 9 flew beneath Landsat 8 as the satellite continued its climb to nominal orbital altitude.

These images of an area in south central Queensland, Australia were acquired by the instruments onboard both Landsat 8 and Landsat 9 on November 15, 2021, as Landsat 9 flew beneath Landsat 8 as the satellite continued its climb to nominal orbital altitude.

Common Landsat Band Combinations

This graphic displays a few of the common band Red-Green-Blue (RGB) combinations of Landsat data. For more information about using Landsat bands in your research, visit the following pages: 

This graphic displays a few of the common band Red-Green-Blue (RGB) combinations of Landsat data. For more information about using Landsat bands in your research, visit the following pages: 

color photo of grasslands in Guymon, OK
Guymon, OK underfly one

Thick vegetation at a Guymon, Oklahoma, site required parking a quarter-mile away. The pickup is visible at the top center of the photo, which was taken on November 11, 2021, the first characterization day there. (Photo by Jeff Irwin, USGS)

Thick vegetation at a Guymon, Oklahoma, site required parking a quarter-mile away. The pickup is visible at the top center of the photo, which was taken on November 11, 2021, the first characterization day there. (Photo by Jeff Irwin, USGS)

satellite map of zhouzhou, china
C2L2 Factsheet Image

Landsat 5 images of Zhuozhou, China, on September 7, 1999, showing top-of-atmosphere (TOA) reflectance; Level-2 surface reflectance (SR); and Level-2 surface temperature (ST), in Kelvin (K). View fact sheet at Landsat Collection 2 Level-2 Science Products (usgs.gov).

Landsat 5 images of Zhuozhou, China, on September 7, 1999, showing top-of-atmosphere (TOA) reflectance; Level-2 surface reflectance (SR); and Level-2 surface temperature (ST), in Kelvin (K). View fact sheet at Landsat Collection 2 Level-2 Science Products (usgs.gov).

Color Landsat 9 image of Lake Erie
Landsat 9 First Light Detroit & Lake Erie

Sediments swirl in Lake Erie and Lake St. Clair in this Landsat 9 image of both Detroit, Michigan, and Windsor, Ontario, from Oct. 31, 2021. The Great Lakes serve as sources of freshwater, recreational activity, transport, and habitat for the upper-midwestern US, and water quality remains a high priority. 

Sediments swirl in Lake Erie and Lake St. Clair in this Landsat 9 image of both Detroit, Michigan, and Windsor, Ontario, from Oct. 31, 2021. The Great Lakes serve as sources of freshwater, recreational activity, transport, and habitat for the upper-midwestern US, and water quality remains a high priority. 

satellite image of himalayas
Landsat 9 First Light Image of the Himalayas

The city of Kathmandu, Nepal, seen at the bottom left of this Landsat 9 image, lies in a valley south of the Himalayan Mountainsbetween Nepal and China. Glaciers, and the lakes formed by glacial meltwater, are visible in the top middle of this image.

The city of Kathmandu, Nepal, seen at the bottom left of this Landsat 9 image, lies in a valley south of the Himalayan Mountainsbetween Nepal and China. Glaciers, and the lakes formed by glacial meltwater, are visible in the top middle of this image.

Color Landsat 9 image of Navajo Nation
Navajo Nation
Navajo Nation
Navajo Nation

In the Western U.S., in places like the Navajo Nation as seen in this Landsat 9 image, Landsat and other satellite data help people monitor drought conditions and manage irrigation water. With only 85 rain gauges to cover more than 27,000 square miles, satellite data and climate models are filling the gaps to help the Navajo Nation monitor drought severity.

In the Western U.S., in places like the Navajo Nation as seen in this Landsat 9 image, Landsat and other satellite data help people monitor drought conditions and manage irrigation water. With only 85 rain gauges to cover more than 27,000 square miles, satellite data and climate models are filling the gaps to help the Navajo Nation monitor drought severity.

Interior of the Lava River Cave
IMG_0302.jpeg
IMG_0302.jpeg
IMG_0302.jpeg

Image showing a section of Lava River Cave, located in Northern Arizona. 

Image showing a section of Lava River Cave, located in Northern Arizona. 

A topographic map showing bedrock topography depicted in red lines through a grey background.
Bedrock Topography of the Willshire 7.5-minute Quadrangle, Ohio-Indiana

This map details the subsurface contact between the consolidated Paleozoic bedrock surface and the overlying unconsolidated Quaternary-aged sediments. This image is used with the permission of the Ohio Department of Natural Resources, Division of Geological Survey and the Indiana Geological and Water Survey. 

This map details the subsurface contact between the consolidated Paleozoic bedrock surface and the overlying unconsolidated Quaternary-aged sediments. This image is used with the permission of the Ohio Department of Natural Resources, Division of Geological Survey and the Indiana Geological and Water Survey. 

Example of the Landsat Collection 2 Burned Area Science Product
Example of the Landsat Collection 2 Burned Area Science Product showing the Bootleg Fire in Oregon

Example of the Landsat Collection 2 Burned Area Science Product showing the Bootleg Fire in Oregon on July 11, 2021 for tile h006V010. Left: Landsat 8 Collection 2 U.S. Analysis Ready Data Surface Reflectance image (Bands 6,5,4), Middle: Burn Classification (BC), and Right: Burn Probability (BP).

Landsat 8 Collection 2 image of the Menindee Lakes in Australia

The Menindee Lakes in the Far West of New South Wales, Australia, are seen in this Landsat 8 Collection 2 image from May 14, 2021, and is shown as a natural color composite using the red, green, and blue bands (Bands 4,3,2).

The Menindee Lakes in the Far West of New South Wales, Australia, are seen in this Landsat 8 Collection 2 image from May 14, 2021, and is shown as a natural color composite using the red, green, and blue bands (Bands 4,3,2).

Landsat 8 Collection 2 image of the Richat Structure

This Landsat 8 Collection 2 image was acquired over the Richat Structure near the western edge of the Sahara Desert on April 25, 2020 and is shown as a natural color composite using the red, green, and blue bands (Bands 4,3,2).

This Landsat 8 Collection 2 image was acquired over the Richat Structure near the western edge of the Sahara Desert on April 25, 2020 and is shown as a natural color composite using the red, green, and blue bands (Bands 4,3,2).

Landsat Collection 2 DSWE Example
Example of the Landsat Collection 2 Dynamic Surface Water Extent Science Product

Example of the Landsat Collection 2 Dynamic Surface Water Science Product showing the Confluence of the Wabash and Ohio Rivers on April 12, 2021,for tile h021V010. Left: Landsat Collection 2 U.S. Analysis Ready Data Surface Reflectance image, Right: Dynamic Surface Water Extent (INTR layer)

Example of the Landsat Collection 2 Dynamic Surface Water Science Product showing the Confluence of the Wabash and Ohio Rivers on April 12, 2021,for tile h021V010. Left: Landsat Collection 2 U.S. Analysis Ready Data Surface Reflectance image, Right: Dynamic Surface Water Extent (INTR layer)

Image of a meteorological station at Sunset Crater, AZ
SUCR cinder field met station.jpeg

The image shows the Astrogeology Science Center experimental meteorological station.

3DEP Funding Gap Scenarios

Bar graphs comparing three partner funding scenarios for completing nationwide 3D Elevation Program data acquisition by 2023. 

Bar graphs comparing three partner funding scenarios for completing nationwide 3D Elevation Program data acquisition by 2023. 

Was this page helpful?