
Image showing a section of Lava River Cave, located in Northern Arizona.
Images
Core Science Systems images.
Filter Total Items: 667

IMG_0302.jpeg
Image showing a section of Lava River Cave, located in Northern Arizona.
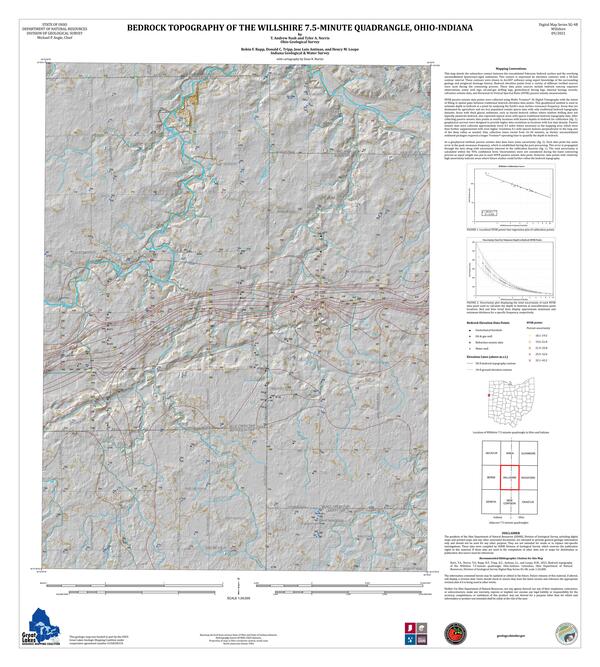
Bedrock Topography of the Willshire 7.5-minute Quadrangle, Ohio-Indiana
Bedrock Topography of the Willshire 7.5-minute Quadrangle, Ohio-IndianaThis map details the subsurface contact between the consolidated Paleozoic bedrock surface and the overlying unconsolidated Quaternary-aged sediments. This image is used with the permission of the Ohio Department of Natural Resources, Division of Geological Survey and the Indiana Geological and Water Survey.

Eyes on Earth - Colorado Bark Beetles homepage
From top, Dr. Kyle Rodman, Dr. Zhiliang Zhu, and Dr. Sarah Hart, pictured with the graphic for the USGS EROS podcast "Eyes on Earth."
From top, Dr. Kyle Rodman, Dr. Zhiliang Zhu, and Dr. Sarah Hart, pictured with the graphic for the USGS EROS podcast "Eyes on Earth."

Example of the Landsat Collection 2 Burned Area Science Product showing the Bootleg Fire in Oregon
Example of the Landsat Collection 2 Burned Area Science Product showing the Bootleg Fire in OregonExample of the Landsat Collection 2 Burned Area Science Product showing the Bootleg Fire in Oregon on July 11, 2021 for tile h006V010. Left: Landsat 8 Collection 2 U.S. Analysis Ready Data Surface Reflectance image (Bands 6,5,4), Middle: Burn Classification (BC), and Right: Burn Probability (BP).

Landsat 8 Collection 2 image of the Menindee Lakes in Australia
Landsat 8 Collection 2 image of the Menindee Lakes in AustraliaThe Menindee Lakes in the Far West of New South Wales, Australia, are seen in this Landsat 8 Collection 2 image from May 14, 2021, and is shown as a natural color composite using the red, green, and blue bands (Bands 4,3,2).

Landsat 8 Collection 2 image of the Richat Structure
Landsat 8 Collection 2 image of the Richat StructureThis Landsat 8 Collection 2 image was acquired over the Richat Structure near the western edge of the Sahara Desert on April 25, 2020 and is shown as a natural color composite using the red, green, and blue bands (Bands 4,3,2).

Example of the Landsat Collection 2 Dynamic Surface Water Extent Science Product
Example of the Landsat Collection 2 Dynamic Surface Water Extent Science ProductExample of the Landsat Collection 2 Dynamic Surface Water Science Product showing the Confluence of the Wabash and Ohio Rivers on April 12, 2021,for tile h021V010. Left: Landsat Collection 2 U.S. Analysis Ready Data Surface Reflectance image, Right: Dynamic Surface Water Extent (INTR layer)

SUCR cinder field met station.jpeg
The image shows the Astrogeology Science Center experimental meteorological station.
The image shows the Astrogeology Science Center experimental meteorological station.

3DEP Funding Gap Scenarios
Bar graphs comparing three partner funding scenarios for completing nationwide 3D Elevation Program data acquisition by 2023.
Bar graphs comparing three partner funding scenarios for completing nationwide 3D Elevation Program data acquisition by 2023.

Landsat 8 Images Labrador
Landsat 8 Surface Reflectance image of the coast of Labrador and Newfoundland
Path 5 Row 23
Date acquired 20210216
Landsat 8 Surface Reflectance image of the coast of Labrador and Newfoundland
Path 5 Row 23
Date acquired 20210216

Glacial deposits being sampled by underground drilling, Lake County, Illinois.
Glacial deposits being sampled by underground drilling, Lake County, Illinois.Glacial deposits are sampled deep underground by drilling (Lake County, Illinois). Geologists analyze sediments to determine physical characteristics, such as the capacity to hold and transmit water or ability to accept a load from a building or bridge.

Hawaii Landsat State Mosaic
The state of Hawaii consists of eight main islands: Niihau, Kauai, Oahu, Molokai, Lanai, Kahoolawe, Maui, and Hawaii. From east to west, Hawaii is the widest state in the country.
Capital Honolulu
Image Source Landsat 8
Population 1,455,271
The state of Hawaii consists of eight main islands: Niihau, Kauai, Oahu, Molokai, Lanai, Kahoolawe, Maui, and Hawaii. From east to west, Hawaii is the widest state in the country.
Capital Honolulu
Image Source Landsat 8
Population 1,455,271
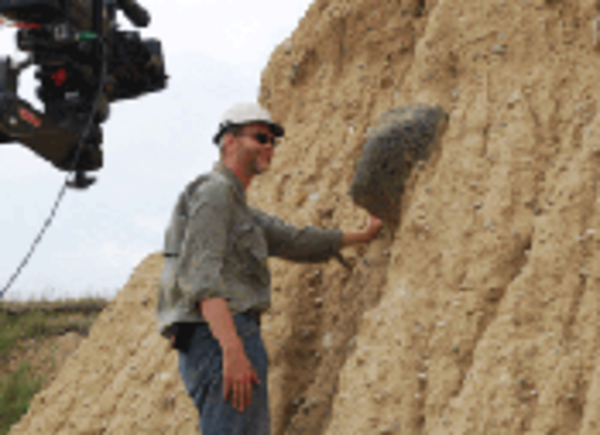
Illinois State Geological Survey geologist analyzes a glacial deposit outcrop
Illinois State Geological Survey geologist analyzes a glacial deposit outcropIllinois State Geological Survey (ISGS) geologists and the State of Illinois are featured in the History Channel's internationally popular program, How the Earth Was Made: America's Ice Age.
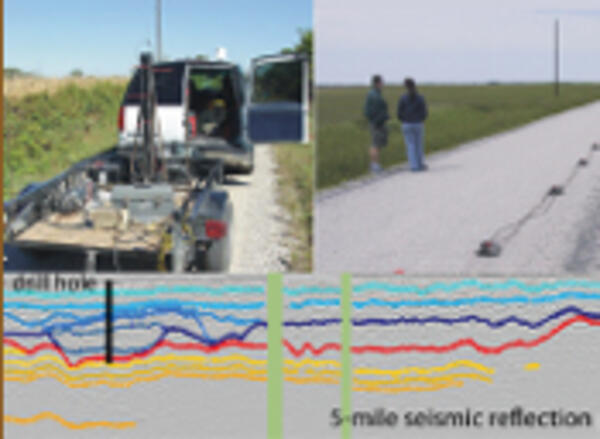
Geophysical surveys help explore the subsurface geology (seismic reflection).
Geophysical surveys help explore the subsurface geology (seismic reflection).Geophysical surveys at the land surface help scientists explore the subsurface geology. Here geologists collect geophysical data using geophones. In the resulting geophysical profile, colors highlight key horizons.

Productivity of Black Oystercatchers in Southwest Alaska
Productivity of Black Oystercatchers in Southwest AlaskaThe black oystercatcher, a keystone species in nearshore ecosystems, plays an important role in structuring nearshore systems and is highly susceptible to human disturbance. Current inventory and monitoring efforts may not adequately address the information needs for estimating long-term trends for this species.

Landsat 8 image showing northeast Mongolia
Landsat 8 image acquired on November 19, 2020 over northeast Mongolia (Path 127 Row 26). The image is shown using the shortwave infrared 1, near infrared, and red bands (bands 6,5,4).
Landsat Scene ID LC08_L1TP_127026_20201119_20201119_01_RT
Landsat 8 image acquired on November 19, 2020 over northeast Mongolia (Path 127 Row 26). The image is shown using the shortwave infrared 1, near infrared, and red bands (bands 6,5,4).
Landsat Scene ID LC08_L1TP_127026_20201119_20201119_01_RT

Landsat 8 image showing southwest Morocco
Landsat 8 image acquired on November 11, 2020 over southwest Morocco (Path 203 Row 40). The image is shown using the shortwave infrared 2, red, and blue bands (bands 7,4,2).
Landsat Scene ID LO08_L1TP_203040_20201107_20201111_01_T1
Landsat 8 image acquired on November 11, 2020 over southwest Morocco (Path 203 Row 40). The image is shown using the shortwave infrared 2, red, and blue bands (bands 7,4,2).
Landsat Scene ID LO08_L1TP_203040_20201107_20201111_01_T1

Silica Crucible and Glass Desiccator
Geochemists use platinum, silica, and ceramic crucibles, shown here in a glass container called a desiccator. Silica is used because it is resistant to extremely high temperatures and because it is chemically inert. Silicon, linked up with a pair of oxygen molecules as silicon dioxide, is known as silica.
Geochemists use platinum, silica, and ceramic crucibles, shown here in a glass container called a desiccator. Silica is used because it is resistant to extremely high temperatures and because it is chemically inert. Silicon, linked up with a pair of oxygen molecules as silicon dioxide, is known as silica.
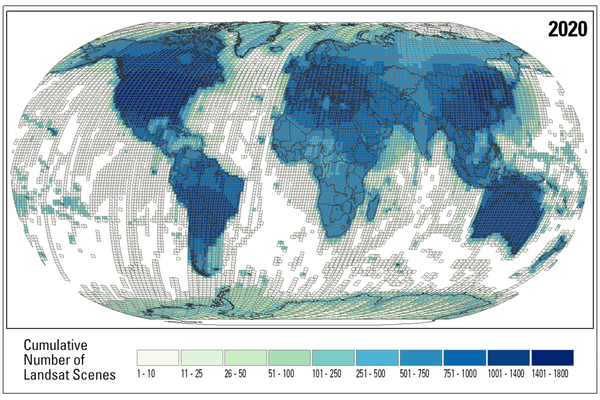
Cumulative number of scenes in the Landsat Archive
Cumulative number of scenes in the Landsat ArchiveThis graphic shows the cumulative number of scenes by path and row in the Landsat archive from 1972 - 2020. This graphic was created on the anniversary of the 9 millionth scene addition to the USGS Landsat Archive.

The 9 millionth scene added to the USGS Landsat Archive
The 9 millionth scene added to the USGS Landsat ArchiveThe USGS Landsat Archive added its 9 millionth scene to the archive on September 18, 2020. The scene was acquired by Landsat 8 over Northern Paraguay and is shown using bands 6,5,4.
The 9 millionth scene added to the USGS Landsat Archive
The 9 millionth scene added to the USGS Landsat ArchiveThe USGS Landsat Archive added its 9 millionth scene to the archive on September 18, 2020. The scene was acquired by Landsat 8 over Northern Paraguay and is shown using bands 6,5,4.

Landsat image on the Utah-Arizona Border of the Navajo Nation
Landsat image on the Utah-Arizona Border of the Navajo NationLandsat 8 image on the Utah-Arizona Border on the Navajo Nation acquired on September 18, 2020.
For more information about Landsat, please visit www.usgs.gov/Landsat
To download the data, visit earthexplorer.usgs.gov