
This map of the United States and its territories shows the areal extent and quality level of planned, in-progress, and existing publicly available lidar (IfSAR in Alaska) data identified by the United States Interagency Elevation Inventory (USIEI) that meet 3DEP base level specification planned to be under award by September 30, 2024. 3DEP base level spec
Images
Core Science Systems images.
Filter Total Items: 667

FY24 Status of 3DEP Quality Data
This map of the United States and its territories shows the areal extent and quality level of planned, in-progress, and existing publicly available lidar (IfSAR in Alaska) data identified by the United States Interagency Elevation Inventory (USIEI) that meet 3DEP base level specification planned to be under award by September 30, 2024. 3DEP base level spec

Tarrabool Lake, Northern Territory
Tarrabool Lake is a seasonal lake in Australia’s Northern Territory. While the lake’s water level fluctuates from year to year, its swampy wetlands and the surrounding tropical forested areas supports an essential habitat for small mammals, reptiles, and a wide variety of bird species.
Tarrabool Lake is a seasonal lake in Australia’s Northern Territory. While the lake’s water level fluctuates from year to year, its swampy wetlands and the surrounding tropical forested areas supports an essential habitat for small mammals, reptiles, and a wide variety of bird species.

Recipients of 2024 Pecora Group Award
Recipients of 2024 Pecora Group Award. The Optical Oceanography Laboratory of the University of South Florida, left to right: Keyu Mao, Cheng Xue, Yao Yao, Madjid Hadjal, Yingjun Zhang, Chuanmin Hu, Siarah Hall, Jennifer Cannizzaro, Brad Nemeth, Junnan Jiao, Brian Barnes, Jing Shi, Sarah Sullivan, Yuyuan Xie, David English.
Recipients of 2024 Pecora Group Award. The Optical Oceanography Laboratory of the University of South Florida, left to right: Keyu Mao, Cheng Xue, Yao Yao, Madjid Hadjal, Yingjun Zhang, Chuanmin Hu, Siarah Hall, Jennifer Cannizzaro, Brad Nemeth, Junnan Jiao, Brian Barnes, Jing Shi, Sarah Sullivan, Yuyuan Xie, David English.

Landsat Reveals Cape Cod's Changing Coastlines
Ocean currents, and the sediments they transport, have constantly shifted the Cape Cod barrier islands over time. Some of the abrupt changes, however, can be linked directly to a storm.
Ocean currents, and the sediments they transport, have constantly shifted the Cape Cod barrier islands over time. Some of the abrupt changes, however, can be linked directly to a storm.

Australia has formally joined the Landsat Next satellite program
Australia has formally joined the Landsat Next satellite programMinister for Foreign Affairs, Penny Wong, and U.S. Secretary of State, Antony Blinken, with the signed bilateral statement on the Landsat Next program.
Australia has formally joined the Landsat Next satellite program
Australia has formally joined the Landsat Next satellite programMinister for Foreign Affairs, Penny Wong, and U.S. Secretary of State, Antony Blinken, with the signed bilateral statement on the Landsat Next program.
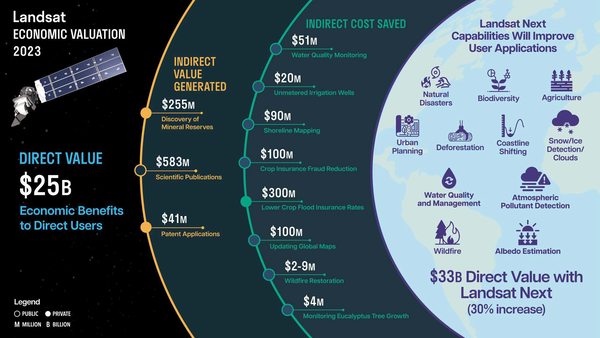
Infographic for Report "Economic Valuation of Landsat and Landsat Next 2023"
Infographic for Report "Economic Valuation of Landsat and Landsat Next 2023"This infographic is from the report "Economic Valuation of Landsat and Landsat Next 2023," which shows that Landsat's direct value in 2023 was \$25.6 billion. The report and infographic also show well over \$1 billion in estimated indirect economic value.

USGS and Australia formally partner for upcoming Landsat Next satellite mission
USGS and Australia formally partner for upcoming Landsat Next satellite missionAlison Rose, Chief of Space Division, Geoscience Australia, and Darcee Killpack, acting Associate Director, Core Science Systems, United States Geological Survey, signing the Memorandum of Understanding formally operationalizing the Landsat Next partnership.

Australia has formally joined the United States-led Landsat Next satellite program
Australia has formally joined the United States-led Landsat Next satellite programMinister for Foreign Affairs, Penny Wong, and U.S. Secretary of State, Antony Blinken, with the signed bilateral statement on the Landsat Next program.

3DHP Map FY24 Partnerships and DCA Projects
This map of the United States and its territories shows geographic extent of the first-ever nationally consistent hydrography data acquired from high-resolution 3D Elevation Program (3DEP) data.
This map of the United States and its territories shows geographic extent of the first-ever nationally consistent hydrography data acquired from high-resolution 3D Elevation Program (3DEP) data.

Mars Curiosity Rover image on sol 4251
This image was taken by the NASA Mars curiosity rover on sol 4251 by the front hazcam.
This image was taken by the NASA Mars curiosity rover on sol 4251 by the front hazcam.

Lidar Point Cloud of the White House and the Herbert Hoover Federal Building
Lidar Point Cloud of the White House and the Herbert Hoover Federal BuildingLidar Point Cloud of the White House and the US Department of Commerce in the Herbert Hoover Federal Building with a green to gray color ramp symbology with green representing low elevation, and gray representing high elevation

Lidar Point Cloud of Delicate Arch at Arches National Park
Lidar Point Cloud of Delicate Arch at Arches National Park3D Rendering of lidar point cloud over Delicate Arch. From USGS_LPC_UT_FEMA_FS_FlamingGorge_2020_B20_12SXH300885.laz. Delicate Arch at Arches National Park in Moab, Utah with a green to gray color ramp symbology with green representing low elevation, and gray representing high elevation
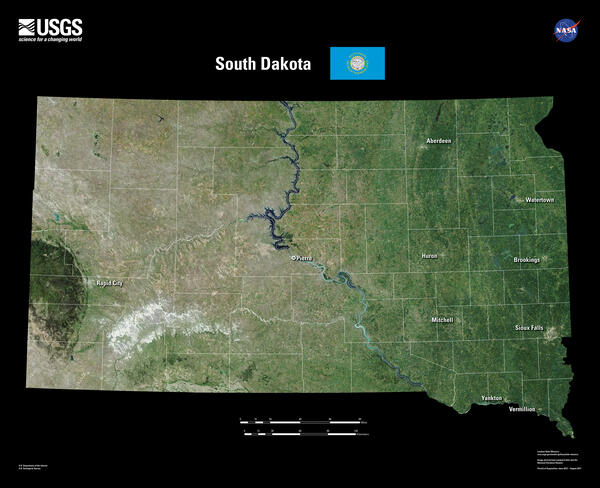
South Dakota Landsat 8 Mosaic
South Dakota is home to the fabled “Black Hills.” Seen from a distance, these pine-covered hills, rising several thousand feet above the surrounding prairie, appear black.
South Dakota is home to the fabled “Black Hills.” Seen from a distance, these pine-covered hills, rising several thousand feet above the surrounding prairie, appear black.
Canyon Creek Watershed 3DHP
Figure 2. Image showing 3D Hydrography Program data for Canyon Creek watershed, Oregon. The colors indicate elevation from low (blue) to high (brown). Both the colors within the watershed and the shaded relief surrounding the watershed are based on data from the 3D Elevation Program.
Figure 2. Image showing 3D Hydrography Program data for Canyon Creek watershed, Oregon. The colors indicate elevation from low (blue) to high (brown). Both the colors within the watershed and the shaded relief surrounding the watershed are based on data from the 3D Elevation Program.

2023 Earth Observation Assessment for agriculture and forestry
2023 Earth Observation Assessment for agriculture and forestryGraphic showing Earth observation inputs found in the 2023 USGEO Earth observation assessment for agriculture and forestry.
2023 Earth Observation Assessment for agriculture and forestry
2023 Earth Observation Assessment for agriculture and forestryGraphic showing Earth observation inputs found in the 2023 USGEO Earth observation assessment for agriculture and forestry.

3DEP Map FY24 Partnerships and DCA Projects
This map of the United States and its territories shows geographic extent of completion of the first-ever national baseline of consistent high-resolution elevation data - both bare earth and 3D point clouds.
This map of the United States and its territories shows geographic extent of completion of the first-ever national baseline of consistent high-resolution elevation data - both bare earth and 3D point clouds.
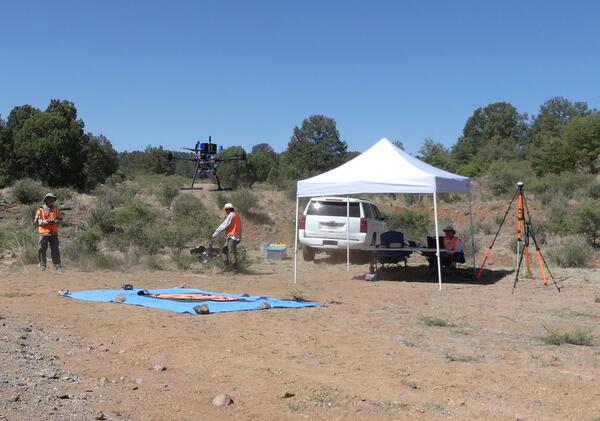
Drone with Gamma Ray Spectrometer
Gamma Ray Spectrometer on drone in New Mexico.
Gamma Ray Spectrometer on drone in New Mexico.

Landsat 8 Image of Ayon Island
Landsat 8's Operational Land Imager (OLI) captured this icy view of Ayon Island on June 17, 2024. The island's low-lying tundra and the shorelines create a picturesque view from its high latitude location in the East Siberian Sea. This unique polar landmass is separated from the mainland by the Malyy Chaunskiy Strait.
Landsat 8's Operational Land Imager (OLI) captured this icy view of Ayon Island on June 17, 2024. The island's low-lying tundra and the shorelines create a picturesque view from its high latitude location in the East Siberian Sea. This unique polar landmass is separated from the mainland by the Malyy Chaunskiy Strait.

Using topoBuilder screenshot, select a map screen.
Using topoBuilder screenshot, select a map screen.Screenshot showing the use of the topoBuilder application to create on demand topographic maps. Step one select a map.
Using topoBuilder screenshot, select a map screen.
Using topoBuilder screenshot, select a map screen.Screenshot showing the use of the topoBuilder application to create on demand topographic maps. Step one select a map.

Using topoBuilder screenshot, customize map.
Screenshot showing the use of the topoBuilder application to create on demand topographic maps, customize map.
Screenshot showing the use of the topoBuilder application to create on demand topographic maps, customize map.

Using topoBuilder screenshot, edit cart screen.
Screenshot showing the use of the topoBuilder application to create on demand topographic maps. Edit cart.
Screenshot showing the use of the topoBuilder application to create on demand topographic maps. Edit cart.