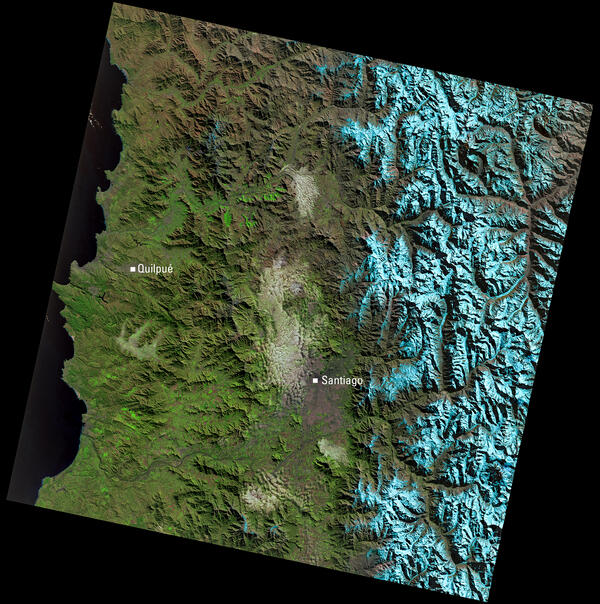
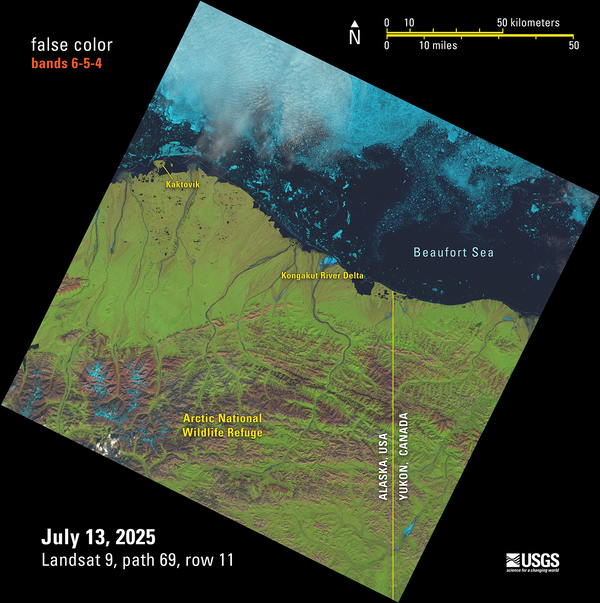
U.S. flag

An official website of the United States government

Images

Core Science Systems images.

Filter Total Items: 652
illustration of a Landsat satellite over the United States
Landsat's View of the USA image

How does your state use Landsat satellite data?  Visit the Landsat’s View of the USA webpage to find how Landsat benefits each of United States. You can download a satellite image, put together an online puzzle, or read a USGS Fact Sheet for your selected state!

How does your state use Landsat satellite data?  Visit the Landsat’s View of the USA webpage to find how Landsat benefits each of United States. You can download a satellite image, put together an online puzzle, or read a USGS Fact Sheet for your selected state!

a satellite image of a river's tributaries flowing into Lake St. Clair, Michigan
Lake St. Clair
Lake St. Clair
Lake St. Clair

Lake St. Clair is a freshwater lake that lies between the State of Michigan and Ontario, Canada. Sometimes it is referred to as “the sixth Great Lake". Lake St. Clair is smaller and shallower than the Great Lakes with a surface area of only 430 square miles and an average depth of 11 feet.

Lake St. Clair is a freshwater lake that lies between the State of Michigan and Ontario, Canada. Sometimes it is referred to as “the sixth Great Lake". Lake St. Clair is smaller and shallower than the Great Lakes with a surface area of only 430 square miles and an average depth of 11 feet.

picture of JACIE 2025 in person attendees
JACIE 2025 Attendees

The JACIE 2025 Workshop in-person attendees are shown in this picture. The Workshop was held April 7-11, 2025. 

Primary uses of Landsat Data Unique Users
Primary uses of Landsat Data by Unique Users

In 2008 Landsat data became accessible to all users at no cost. This graphic displays the primary uses of "unique users" of Landsat data. 

View more statistics on the Landsat Project Statistics page.

In 2008 Landsat data became accessible to all users at no cost. This graphic displays the primary uses of "unique users" of Landsat data. 

View more statistics on the Landsat Project Statistics page.

Primary Uses of Landsat Data by Volume

In 2008 Landsat data became accessible to all users at no cost. This graphic displays the primary uses of Landsat data by volume. 

View more statistics on the Landsat Project Statistics page.

In 2008 Landsat data became accessible to all users at no cost. This graphic displays the primary uses of Landsat data by volume. 

View more statistics on the Landsat Project Statistics page.

Landsat 8 image of any area in the east central portion of the United States showing flooding April 7, 2025
April 2025 Flooding in the US

Powerful storms containing heavy rains caused major flooding to areas in the east central portion of the United States in early April 2025. Some communities in Kentucky saw more than 15 inches of rain, according to the National Weather Service.

Powerful storms containing heavy rains caused major flooding to areas in the east central portion of the United States in early April 2025. Some communities in Kentucky saw more than 15 inches of rain, according to the National Weather Service.

Landsat 8 image of an area of the east central portion of the United States on March 22, 2025, before flooding
March 2025 Before Flooding in the US

This Landsat 8 image shows an area of the east central portion of the United States on March 22, 2025. The muted hues of tan pocked with some green areas indicate vegetation awakening from winter dormancy, and the reservoirs and waterways are well within their banks. 

This Landsat 8 image shows an area of the east central portion of the United States on March 22, 2025. The muted hues of tan pocked with some green areas indicate vegetation awakening from winter dormancy, and the reservoirs and waterways are well within their banks. 

Satellite image of the Strait of Belle Isle showing L’Anse-au-Loup and Flowers Cove
Landsat View of the Strait of Belle Isle, Canada

This Landsat 9 image of the Strait of Belle Isle, acquired April 8, 2025, uses the shortwave infrared, near infrared, and red spectral bands (bands 6,5,4) to highlight land cover. In this combination, healthy vegetation appears bright green, snow and ice appear in shades of cyan and blue, and water appears dark.

This Landsat 9 image of the Strait of Belle Isle, acquired April 8, 2025, uses the shortwave infrared, near infrared, and red spectral bands (bands 6,5,4) to highlight land cover. In this combination, healthy vegetation appears bright green, snow and ice appear in shades of cyan and blue, and water appears dark.

a satellite image showing shades of brown and green
Landsat View of Central Germany and the Harz Mountains

This Landsat 9 image highlights central Germany, including the Harz Mountains to the west and the cities of Magdeburg and Leipzig. The scene uses a shortwave infrared, near-infrared, and red band combination (Bands 6, 5, 4), which enhances vegetation in bright green and helps distinguish urban areas and water features.

This Landsat 9 image highlights central Germany, including the Harz Mountains to the west and the cities of Magdeburg and Leipzig. The scene uses a shortwave infrared, near-infrared, and red band combination (Bands 6, 5, 4), which enhances vegetation in bright green and helps distinguish urban areas and water features.

Satellite image of the Colorado River delta and the Gulf of California near San Luis Río Colorado, Mexico.
Landsat View of the Colorado River Delta and Gulf of California

This Landsat 9 image of northwestern Mexico, acquired March 30, 2025, uses the natural color combination of red, green, and blue spectral bands (bands 4,3,2). The scene highlights the Colorado River Delta, where desert meets irrigated farmland near San Luis Río Colorado, before flowing into the blue-green waters of the Gulf of California.

This Landsat 9 image of northwestern Mexico, acquired March 30, 2025, uses the natural color combination of red, green, and blue spectral bands (bands 4,3,2). The scene highlights the Colorado River Delta, where desert meets irrigated farmland near San Luis Río Colorado, before flowing into the blue-green waters of the Gulf of California.

Depiction of the Geoheritage Sites of the Nation Explorer showing the continental United States with green location markers of geoheritage sites.
Geoheritage Explorer.jpg

This is an image of the Geoheritage Sites of the Nation Explorer, which is an interactive web map application featuring the 55 geoheritage sites from the Geoheritage Sites of the Nation Data Release v.1. 

This is an image of the Geoheritage Sites of the Nation Explorer, which is an interactive web map application featuring the 55 geoheritage sites from the Geoheritage Sites of the Nation Data Release v.1. 

A geologic map of the state of Wisconsin.
Quaternary Geology of Wisconsin

This is a geologic map showing the Quaternary geology of the state of Wisconsin. It is an update to an older map that was published in 2025 after many years of mapping done by the Wisconsin Geological and Natural History Survey. 

This is a geologic map showing the Quaternary geology of the state of Wisconsin. It is an update to an older map that was published in 2025 after many years of mapping done by the Wisconsin Geological and Natural History Survey. 

Landsat mosaic of Fort Peck Lake in Montana, showing an icy and snowy landscape.
Landsat Mosaic of Fort Peck Lake, Montana

Fort Peck Lake, a sprawling reservoir formed by the Fort Peck Dam on the Missouri River, lies in the eastern prairie region of Montana near the city of Glasgow. According to the U.S.

Fort Peck Lake, a sprawling reservoir formed by the Fort Peck Dam on the Missouri River, lies in the eastern prairie region of Montana near the city of Glasgow. According to the U.S.

False color Landsat 8 image of Mount Etna in Italy, showing the glowing lava flow
False Color Landsat 8 Image of Mount Etna

Mount Etna is Europe’s largest and most active volcano. Located on the eastern coast of Sicily, Italy, in the province of Catania, the active stratovolcano is known for its frequent and persistent eruptions. Activity can range from explosive eruptions to lava flows and ash emissions.

Mount Etna is Europe’s largest and most active volcano. Located on the eastern coast of Sicily, Italy, in the province of Catania, the active stratovolcano is known for its frequent and persistent eruptions. Activity can range from explosive eruptions to lava flows and ash emissions.

Natural color Landsat 8 image of Mount Etna in Italy, showing layers of ash on the snow-capped volcano
Natural Color Landsat 8 Image of Mount Etna

Mount Etna is Europe’s largest and most active volcano. Located on the eastern coast of Sicily, Italy, in the province of Catania, the active stratovolcano is known for its frequent and persistent eruptions. Activity can range from explosive eruptions to lava flows and ash emissions.

Mount Etna is Europe’s largest and most active volcano. Located on the eastern coast of Sicily, Italy, in the province of Catania, the active stratovolcano is known for its frequent and persistent eruptions. Activity can range from explosive eruptions to lava flows and ash emissions.

Number of Landsat Citations
Landsat Citations
Landsat Citations
Landsat Citations

This graphic below displays the number of Landsat-related publications (orange line) starting in 1970. While publications decreased during the Commercialization Era, research rebounded greatly after the USGS open data policy decision in 2008.

This graphic below displays the number of Landsat-related publications (orange line) starting in 1970. While publications decreased during the Commercialization Era, research rebounded greatly after the USGS open data policy decision in 2008.

Landsat Level-1 Mosaic of the Chesapeake Bay
Landsat Mosaic of the Chesapeake Bay

The Chesapeake Bay is the largest estuary in the United States. Located in the Mid-Atlantic region of the East Coast, it runs north-south from the mouth of the Susquehanna River near Havre de Grace, Maryland, to the Atlantic Ocean near Virginia Beach, Virginia.

The Chesapeake Bay is the largest estuary in the United States. Located in the Mid-Atlantic region of the East Coast, it runs north-south from the mouth of the Susquehanna River near Havre de Grace, Maryland, to the Atlantic Ocean near Virginia Beach, Virginia.

Annual NLCD map of the Chesapeake Bay region, showing the extent of the Bay and major urban areas
Annual NLCD for the Chesapeake Bay Region

The Chesapeake Bay watershed has experienced substantial population growth over the last several decades. Since 1950, the population has more than doubled, and between 1980 and 2023, the number increased from 12.7 million to 18.6 million.

The Chesapeake Bay watershed has experienced substantial population growth over the last several decades. Since 1950, the population has more than doubled, and between 1980 and 2023, the number increased from 12.7 million to 18.6 million.

Landsat Level-3 Dynamic Surface Water Extent of the Chesapeake Bay

The Chesapeake Bay is roughly 200 miles (322 kilometers) in length and varies in width from a mere 4 miles (6.4 kilometers) near Aberdeen, Maryland, to 30 miles (48 kilometers) near Cape Charles, Virginia.

Landsat Level-2 mosaic of Band 4 Provisional Aquatic Reflectance of the Chesapeake Bay
Landsat Level-2 Provisional Aquatic Reflectance of the Chesapeake Bay

The Chesapeake Bay watershed spans more than 64,000 square miles (166,000 square kilometers) and encompasses parts of six states—Delaware, Maryland, New York, Pennsylvania, Virginia, and West Virginia—and the District of Columbia.

Aerial view of the construction of a lithium mine
Thacker Pass Lithium Mining

A bird’s eye view of the Thacker Pass lithium mine captured in late February 2025 reveals the contours of the process plant pad taking shape. Lithium Americas, the company that owns the mine, used Landsat data to help determine its potential impact on sagebrush environments and groundwater.

A bird’s eye view of the Thacker Pass lithium mine captured in late February 2025 reveals the contours of the process plant pad taking shape. Lithium Americas, the company that owns the mine, used Landsat data to help determine its potential impact on sagebrush environments and groundwater.

Was this page helpful?