
This Landsat 9 image of the Strait of Belle Isle, acquired April 8, 2025, uses the shortwave infrared, near infrared, and red spectral bands (bands 6,5,4) to highlight land cover. In this combination, healthy vegetation appears bright green, snow and ice appear in shades of cyan and blue, and water appears dark.
Images
Core Science Systems images.
Filter Total Items: 667
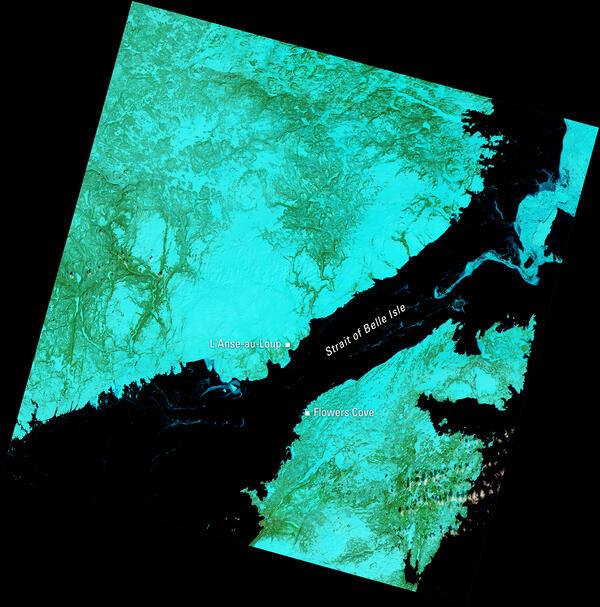
Landsat View of the Strait of Belle Isle, Canada
This Landsat 9 image of the Strait of Belle Isle, acquired April 8, 2025, uses the shortwave infrared, near infrared, and red spectral bands (bands 6,5,4) to highlight land cover. In this combination, healthy vegetation appears bright green, snow and ice appear in shades of cyan and blue, and water appears dark.
Landsat View of Central Germany and the Harz Mountains
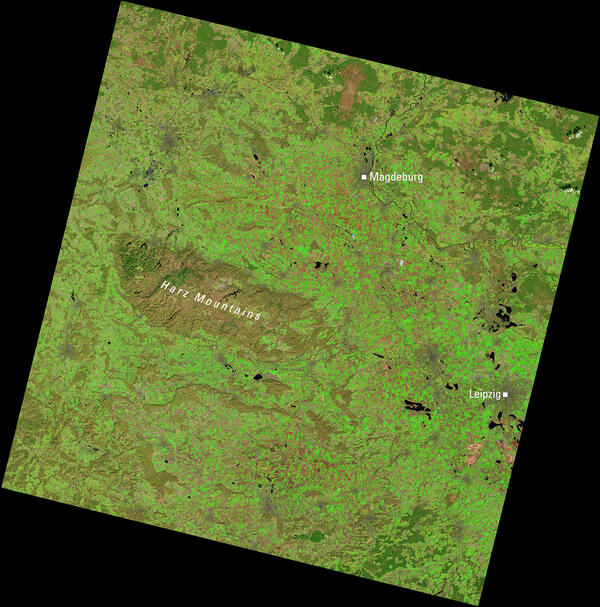
Landsat View of Central Germany and the Harz MountainsThis Landsat 9 image highlights central Germany, including the Harz Mountains to the west and the cities of Magdeburg and Leipzig. The scene uses a shortwave infrared, near-infrared, and red band combination (Bands 6, 5, 4), which enhances vegetation in bright green and helps distinguish urban areas and water features.
Landsat View of Central Germany and the Harz Mountains
Landsat View of Central Germany and the Harz MountainsThis Landsat 9 image highlights central Germany, including the Harz Mountains to the west and the cities of Magdeburg and Leipzig. The scene uses a shortwave infrared, near-infrared, and red band combination (Bands 6, 5, 4), which enhances vegetation in bright green and helps distinguish urban areas and water features.
Landsat View of the Colorado River Delta and Gulf of California
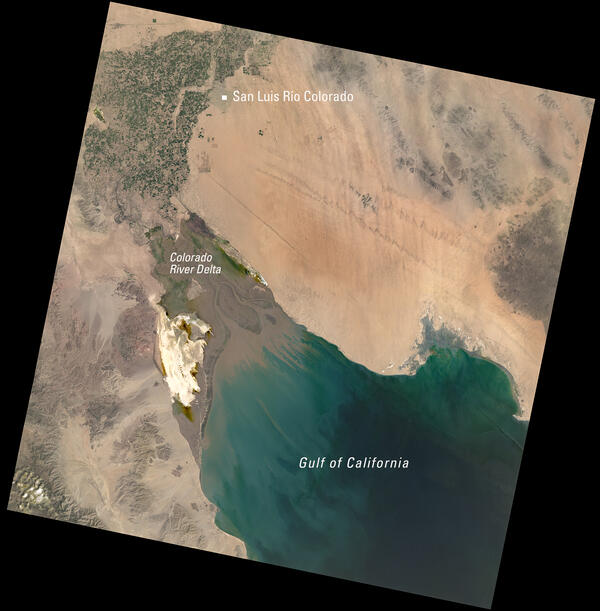
Landsat View of the Colorado River Delta and Gulf of CaliforniaThis Landsat 9 image of northwestern Mexico, acquired March 30, 2025, uses the natural color combination of red, green, and blue spectral bands (bands 4,3,2). The scene highlights the Colorado River Delta, where desert meets irrigated farmland near San Luis Río Colorado, before flowing into the blue-green waters of the Gulf of California.
Landsat View of the Colorado River Delta and Gulf of California
Landsat View of the Colorado River Delta and Gulf of CaliforniaThis Landsat 9 image of northwestern Mexico, acquired March 30, 2025, uses the natural color combination of red, green, and blue spectral bands (bands 4,3,2). The scene highlights the Colorado River Delta, where desert meets irrigated farmland near San Luis Río Colorado, before flowing into the blue-green waters of the Gulf of California.

Geoheritage Explorer.jpg
This is an image of the Geoheritage Sites of the Nation Explorer, which is an interactive web map application featuring the 55 geoheritage sites from the Geoheritage Sites of the Nation Data Release v.1.
This is an image of the Geoheritage Sites of the Nation Explorer, which is an interactive web map application featuring the 55 geoheritage sites from the Geoheritage Sites of the Nation Data Release v.1.
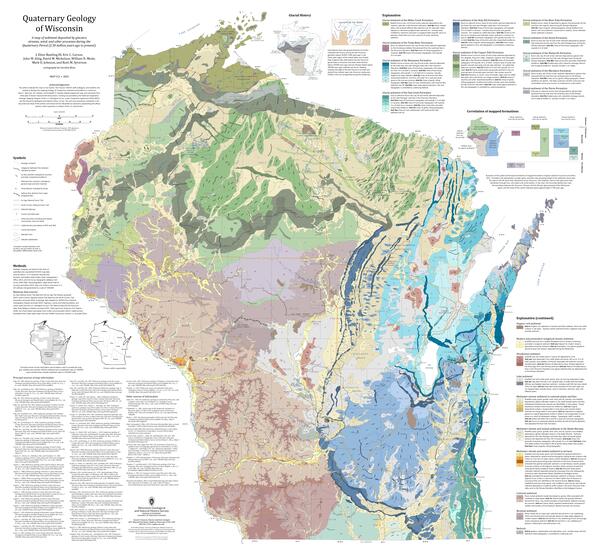
Quaternary Geology of Wisconsin
This is a geologic map showing the Quaternary geology of the state of Wisconsin. It is an update to an older map that was published in 2025 after many years of mapping done by the Wisconsin Geological and Natural History Survey.
This is a geologic map showing the Quaternary geology of the state of Wisconsin. It is an update to an older map that was published in 2025 after many years of mapping done by the Wisconsin Geological and Natural History Survey.

Landsat Mosaic of Fort Peck Lake, Montana
Fort Peck Lake, a sprawling reservoir formed by the Fort Peck Dam on the Missouri River, lies in the eastern prairie region of Montana near the city of Glasgow. According to the U.S.
Fort Peck Lake, a sprawling reservoir formed by the Fort Peck Dam on the Missouri River, lies in the eastern prairie region of Montana near the city of Glasgow. According to the U.S.

False Color Landsat 8 Image of Mount Etna
Mount Etna is Europe’s largest and most active volcano. Located on the eastern coast of Sicily, Italy, in the province of Catania, the active stratovolcano is known for its frequent and persistent eruptions. Activity can range from explosive eruptions to lava flows and ash emissions.
Mount Etna is Europe’s largest and most active volcano. Located on the eastern coast of Sicily, Italy, in the province of Catania, the active stratovolcano is known for its frequent and persistent eruptions. Activity can range from explosive eruptions to lava flows and ash emissions.

Natural Color Landsat 8 Image of Mount Etna
Mount Etna is Europe’s largest and most active volcano. Located on the eastern coast of Sicily, Italy, in the province of Catania, the active stratovolcano is known for its frequent and persistent eruptions. Activity can range from explosive eruptions to lava flows and ash emissions.
Mount Etna is Europe’s largest and most active volcano. Located on the eastern coast of Sicily, Italy, in the province of Catania, the active stratovolcano is known for its frequent and persistent eruptions. Activity can range from explosive eruptions to lava flows and ash emissions.

Landsat Mosaic of the Chesapeake Bay
The Chesapeake Bay is the largest estuary in the United States. Located in the Mid-Atlantic region of the East Coast, it runs north-south from the mouth of the Susquehanna River near Havre de Grace, Maryland, to the Atlantic Ocean near Virginia Beach, Virginia.
The Chesapeake Bay is the largest estuary in the United States. Located in the Mid-Atlantic region of the East Coast, it runs north-south from the mouth of the Susquehanna River near Havre de Grace, Maryland, to the Atlantic Ocean near Virginia Beach, Virginia.

Annual NLCD for the Chesapeake Bay Region
The Chesapeake Bay watershed has experienced substantial population growth over the last several decades. Since 1950, the population has more than doubled, and between 1980 and 2023, the number increased from 12.7 million to 18.6 million.
The Chesapeake Bay watershed has experienced substantial population growth over the last several decades. Since 1950, the population has more than doubled, and between 1980 and 2023, the number increased from 12.7 million to 18.6 million.

Landsat Level-3 Dynamic Surface Water Extent of the Chesapeake Bay
Landsat Level-3 Dynamic Surface Water Extent of the Chesapeake BayThe Chesapeake Bay is roughly 200 miles (322 kilometers) in length and varies in width from a mere 4 miles (6.4 kilometers) near Aberdeen, Maryland, to 30 miles (48 kilometers) near Cape Charles, Virginia.

Landsat Level-2 Provisional Aquatic Reflectance of the Chesapeake Bay
Landsat Level-2 Provisional Aquatic Reflectance of the Chesapeake BayThe Chesapeake Bay watershed spans more than 64,000 square miles (166,000 square kilometers) and encompasses parts of six states—Delaware, Maryland, New York, Pennsylvania, Virginia, and West Virginia—and the District of Columbia.
Thacker Pass Lithium Mining
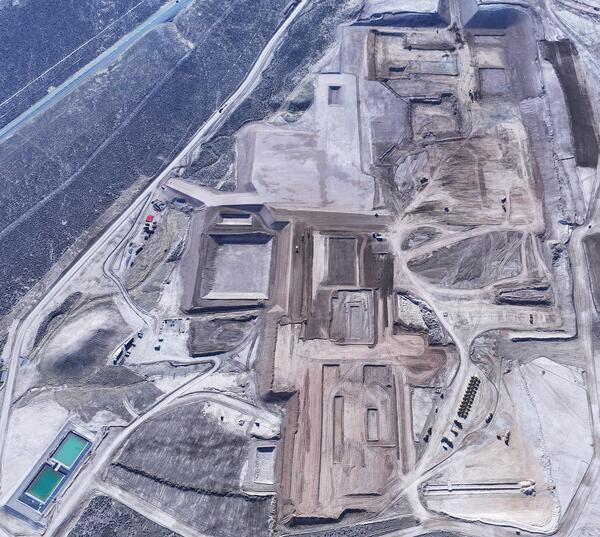
A bird’s eye view of the Thacker Pass lithium mine captured in late February 2025 reveals the contours of the process plant pad taking shape. Lithium Americas, the company that owns the mine, used Landsat data to help determine its potential impact on sagebrush environments and groundwater.
A bird’s eye view of the Thacker Pass lithium mine captured in late February 2025 reveals the contours of the process plant pad taking shape. Lithium Americas, the company that owns the mine, used Landsat data to help determine its potential impact on sagebrush environments and groundwater.

Landsat 8 Image of Snowfall in Houston, Texas
On Tuesday, January 21, 2025, Winter Storm Enzo brought an exceptionally rare snowfall to the Greater Houston metro area of Texas. The National Weather Service reported 5.5 inches (14 cm) in Baytown, a city located east of Houston on the northern shore of Galveston Bay. Other cities and locales received upwards of 3 to 4 inches (7.6 to 10.2 cm).
On Tuesday, January 21, 2025, Winter Storm Enzo brought an exceptionally rare snowfall to the Greater Houston metro area of Texas. The National Weather Service reported 5.5 inches (14 cm) in Baytown, a city located east of Houston on the northern shore of Galveston Bay. Other cities and locales received upwards of 3 to 4 inches (7.6 to 10.2 cm).

Landsat Collection 2 Level-2 Science Products
The USGS provides research-quality, applications-ready Landsat Level-2 and Level-3 science products to support an array of land surface change studies. Collection 2 Level-2 scene-based science products include Surface Reflectance, Surface Temperature, Surface Reflectance-Derived Spectral Indices, and Provisional Aquatic Reflectance.
The USGS provides research-quality, applications-ready Landsat Level-2 and Level-3 science products to support an array of land surface change studies. Collection 2 Level-2 scene-based science products include Surface Reflectance, Surface Temperature, Surface Reflectance-Derived Spectral Indices, and Provisional Aquatic Reflectance.

Landsat 8 Image of the Salt Dome Islands of Louisiana
Landsat 8 Image of the Salt Dome Islands of LouisianaLouisiana is home to numerous salt domes, including the five distinct coastal salt dome islands that can be found in the southern part of the state near the Gulf of America. Formed by the upward pressure of ancient salt deposits, these hills rise above the surrounding marshes and coastal plains of Louisiana.

Landsat 9 Image of the Greater Los Angeles Fires - January 14, 2025 (During)
Landsat 9 Image of the Greater Los Angeles Fires - January 14, 2025 (During)The tragic fires sweeping across the Greater Los Angeles area in January 2025 have burned more than 40,000 acres, destroyed more than 12,300 structures, and prompted evacuation orders and warnings for as many as 200,000 residents. Exceptionally dry conditions, coupled with strong Santa Ana winds, have fueled the fires.

Landsat 8 Image of the Greater Los Angeles Fires - January 6, 2025 (Before)
Landsat 8 Image of the Greater Los Angeles Fires - January 6, 2025 (Before)The tragic fires sweeping across the Greater Los Angeles area have burned more than 40,000 acres, destroyed more than 12,300 structures, and prompted evacuation orders and warnings for as many as 200,000 residents. Exceptionally dry conditions, coupled with strong Santa Ana winds, have fueled the fires.

Landsat 9 Image of Emi Koussi in Chad
Landsat 8 and Landsat 9 kicked off 2025 by acquiring over 1,400 scenes on the first of January. This Landsat 9 image of Emi Koussi in the Tibesti Range of Chad is a mosaic of two of the many scenes collected. Emi Koussi is an extinct shield volcano that rises to 11,204 feet (3,415 meters) above sea level, making it the highest summit in Chad and the Sahara Desert.
Landsat 8 and Landsat 9 kicked off 2025 by acquiring over 1,400 scenes on the first of January. This Landsat 9 image of Emi Koussi in the Tibesti Range of Chad is a mosaic of two of the many scenes collected. Emi Koussi is an extinct shield volcano that rises to 11,204 feet (3,415 meters) above sea level, making it the highest summit in Chad and the Sahara Desert.
Shrub Distribution Over the McDermitt Caldera Region
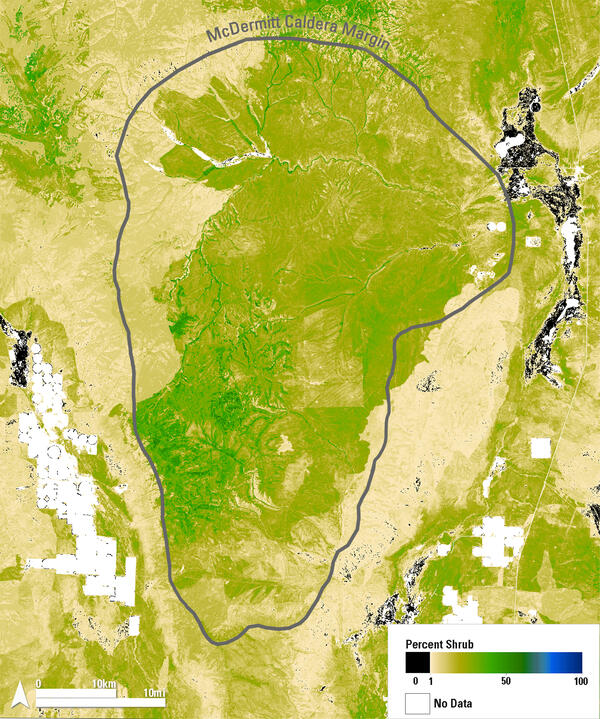
Shrub Distribution Over the McDermitt Caldera RegionThis map shows 2024 shrub cover from the Rangeland Condition Monitoring Assessment and Projection (RCMAP) project across the McDermitt Caldera, outlined in gray, along the Nevada–Oregon border. Dark green areas indicate high shrub cover, typically found in riparian zones and at higher elevations.
Shrub Distribution Over the McDermitt Caldera Region
Shrub Distribution Over the McDermitt Caldera RegionThis map shows 2024 shrub cover from the Rangeland Condition Monitoring Assessment and Projection (RCMAP) project across the McDermitt Caldera, outlined in gray, along the Nevada–Oregon border. Dark green areas indicate high shrub cover, typically found in riparian zones and at higher elevations.
2024 GLGMC: Surficial Geology of Project Areas within Michigan
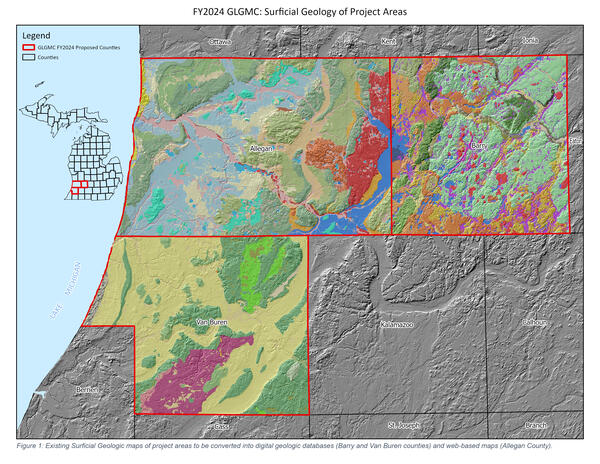
2024 GLGMC: Surficial Geology of Project Areas within MichiganExisting surficial geologic maps of project areas to be converted to digital geologic databases (Barry and Van Buren counties) and web-based maps (Allegan County).
2024 GLGMC: Surficial Geology of Project Areas within Michigan
2024 GLGMC: Surficial Geology of Project Areas within MichiganExisting surficial geologic maps of project areas to be converted to digital geologic databases (Barry and Van Buren counties) and web-based maps (Allegan County).