
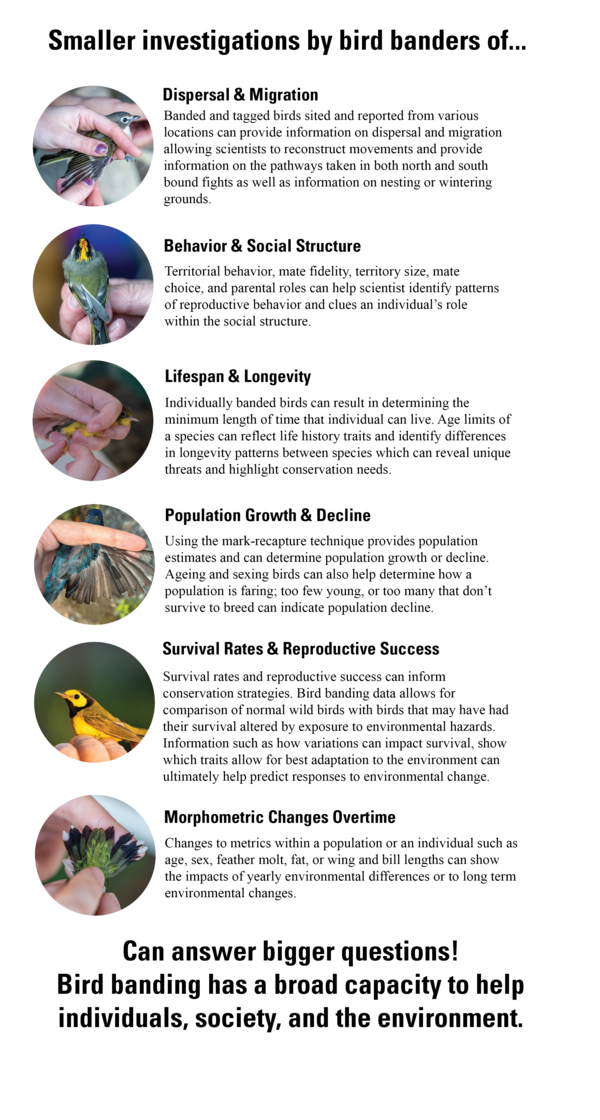
A graphic depiction of what banders can learn from banding information.
Images
See our science through the images below.
Filter Total Items: 3536
WhyDoWeBandBirds
A graphic depiction of what banders can learn from banding information.
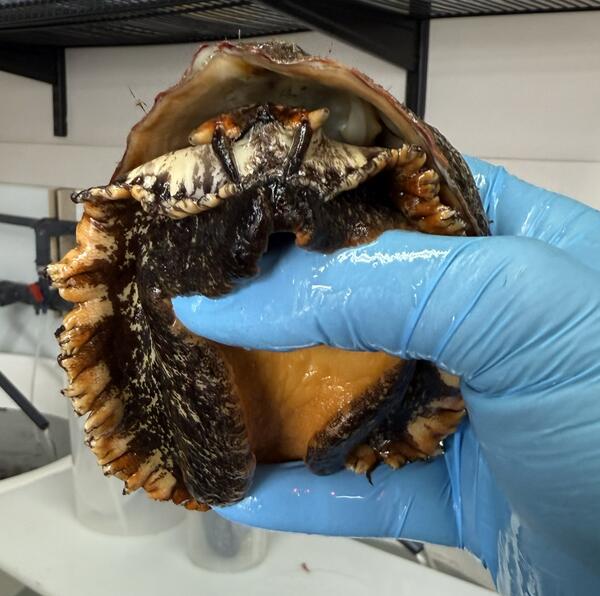
Scientists Holding Pinto Abalone
This is an image of a scientist holding a Pinto Abalone. Pinto abalone, once a familiar presence in Washington’s coastal ecosystems, have suffered a decline since.
This is an image of a scientist holding a Pinto Abalone. Pinto abalone, once a familiar presence in Washington’s coastal ecosystems, have suffered a decline since.
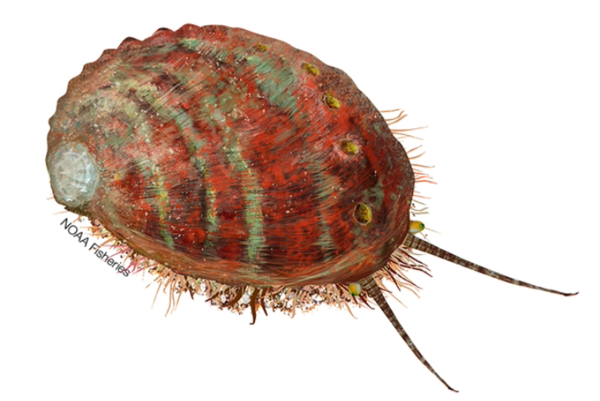
Pinto Abalone Illustration (NOAA)
This is an illustration of a Pinto abalone.
This is an illustration of a Pinto abalone.
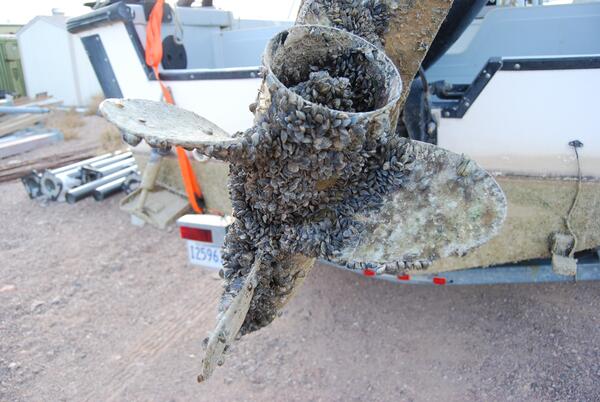
Boat with Invasive Mussel Infestation
This is an image of a boat propeller with an invasive mussel infestation.
This is an image of a boat propeller with an invasive mussel infestation.
Scientist Holding a Lost River Sucker Fish
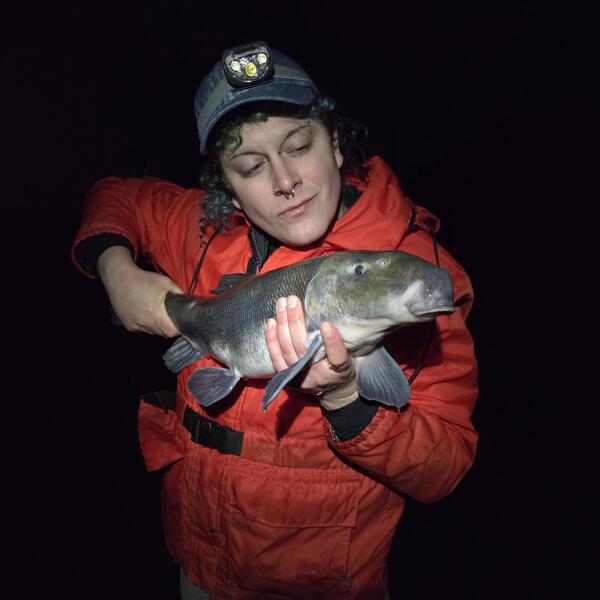
This is a photo of scientist, Ramona Rapp, holding a Lost River Sucker that was tagged in Klamath Falls, OR.
This is a photo of scientist, Ramona Rapp, holding a Lost River Sucker that was tagged in Klamath Falls, OR.
Clay Raines
Clayton Raines, PhD, is a fish biologist at the Eastern Ecological Science Center in Leetown, WV.
Clayton Raines, PhD, is a fish biologist at the Eastern Ecological Science Center in Leetown, WV.
Invasive Mussel Parameters for Hatchery Vulnerability
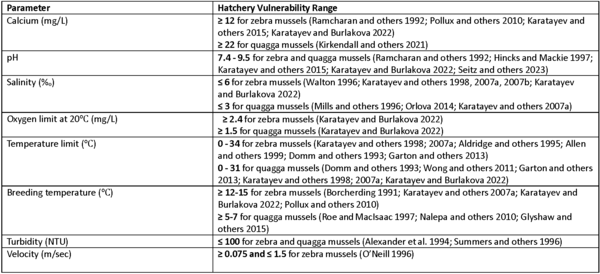
Invasive Mussel Parameters for Hatchery VulnerabilityHatchery vulnerability range for key zebra mussel (Dreissena polumorpha) and quagga mussel (Dreissena rostriformis bugensis) parameters. If your hatchery is within range of all the vulnerability parameters for a given organism, it is at risk for settlement.
Invasive Mussel Parameters for Hatchery Vulnerability
Invasive Mussel Parameters for Hatchery VulnerabilityHatchery vulnerability range for key zebra mussel (Dreissena polumorpha) and quagga mussel (Dreissena rostriformis bugensis) parameters. If your hatchery is within range of all the vulnerability parameters for a given organism, it is at risk for settlement.
6PPDQ Toxicity in Fish
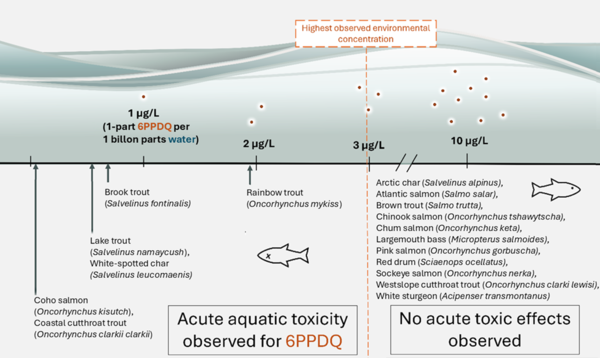
This is an infographic detailing 6PPDQ toxicity levels in different fish species.
This is an infographic detailing 6PPDQ toxicity levels in different fish species.
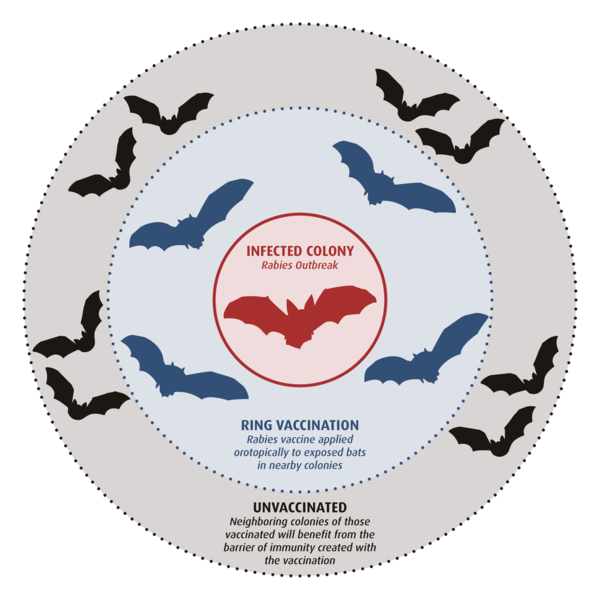
Ring Vaccination - Rabies and Vampire Bats
Scientists at the USGS National Wildlife Health Center have been working on vaccines to protect bats from diseases like such as rabies and white-nose syndrome. The most promising method is called orotopical vaccination. By applying the vaccine to the bat’s muzzle, the gel-based vaccine is spread to others in the colony through grooming.
Scientists at the USGS National Wildlife Health Center have been working on vaccines to protect bats from diseases like such as rabies and white-nose syndrome. The most promising method is called orotopical vaccination. By applying the vaccine to the bat’s muzzle, the gel-based vaccine is spread to others in the colony through grooming.
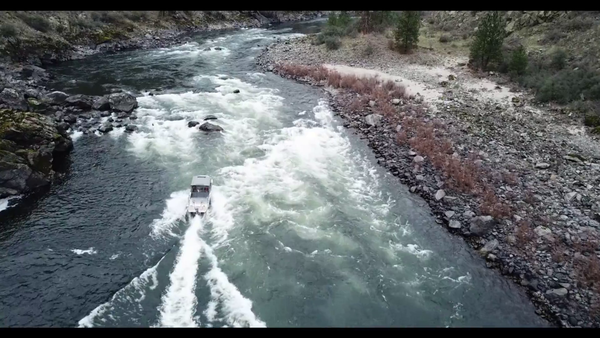
Boat on Salmon River
This photo is from USGS Western Fisheries Research Center’s field work on the lower Salmon River this past Fall. Partnering with the Nez Perce Tribe, Rhodes and his team were counting the number of fall Chinook salmon nests, known as redds, with a drone piloted from a jet boat.
This photo is from USGS Western Fisheries Research Center’s field work on the lower Salmon River this past Fall. Partnering with the Nez Perce Tribe, Rhodes and his team were counting the number of fall Chinook salmon nests, known as redds, with a drone piloted from a jet boat.
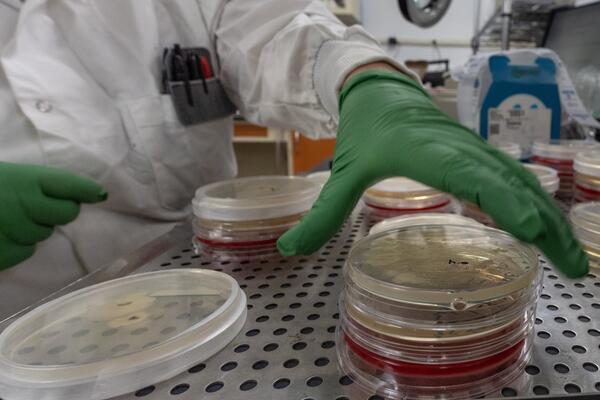
Scientists investigate pathogens in salamanders
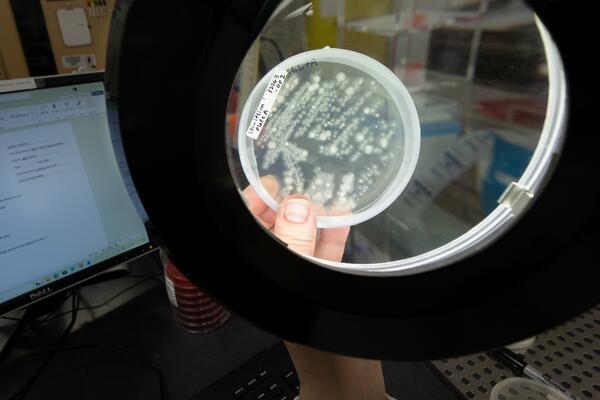
A USGS scientist reaches for a microbiological plate with cultures from salamander skin to investigate for potential pathogens.
A USGS scientist reaches for a microbiological plate with cultures from salamander skin to investigate for potential pathogens.
Scientists investigate pathogens in salamanders
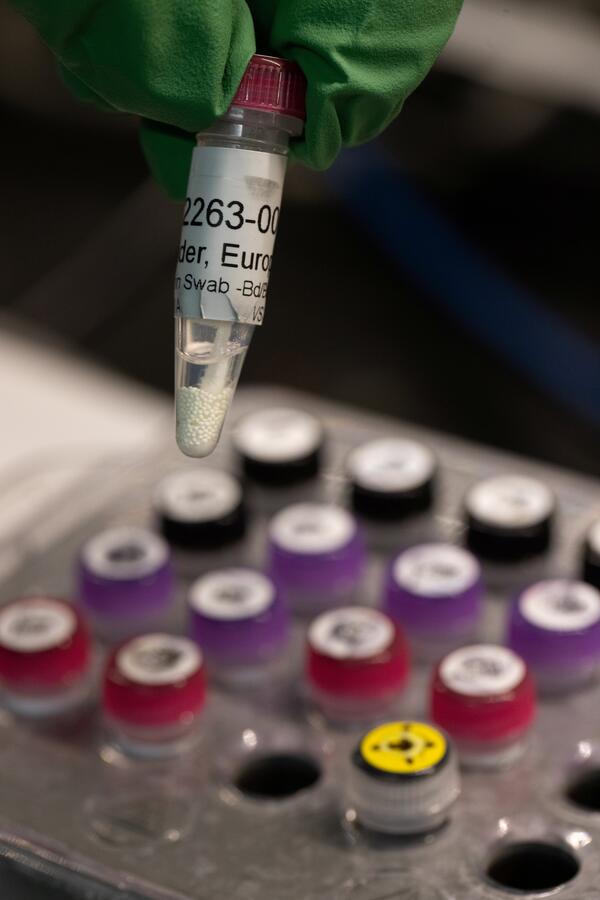
A USGS scientist prepares to analyze a skin swab from a salamander to investigate for potential pathogens.
A USGS scientist prepares to analyze a skin swab from a salamander to investigate for potential pathogens.
Scientists investigate pathogens in salamanders
A USGS scientist examines microorganisms from salamander skin to investigate for potential pathogens.
A USGS scientist examines microorganisms from salamander skin to investigate for potential pathogens.
Scientists investigate pathogens in salamanders
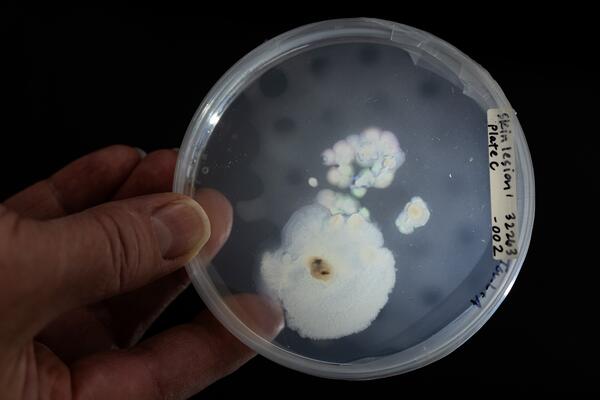
A USGS scientist examines a skin sample from a salamander as part of a study to investigate for potential pathogens.
A USGS scientist examines a skin sample from a salamander as part of a study to investigate for potential pathogens.
Exterior of FIDO: A new eDNA sampler
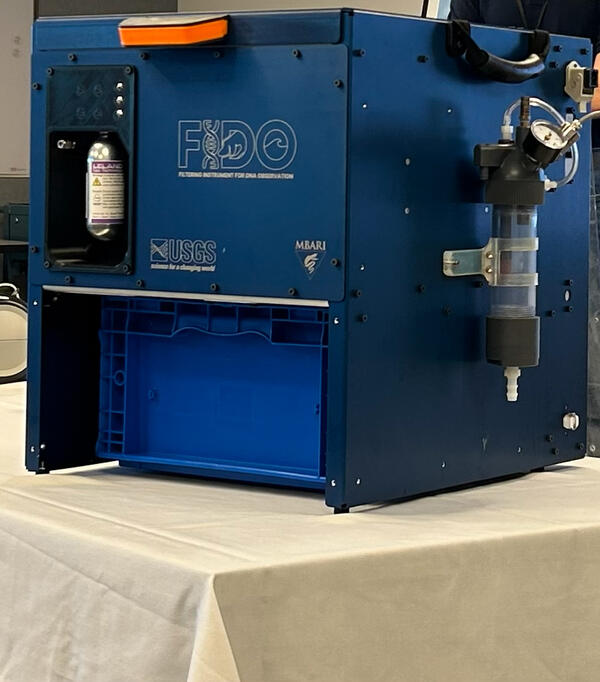
The exterior of FIDO, a new instrument developed by the Monterey Bay Aquarium Research Institute (MBARI) and the USGS Rapid eDNA Assessment and Deployment Initiative and Network (READI-Net) project.
The exterior of FIDO, a new instrument developed by the Monterey Bay Aquarium Research Institute (MBARI) and the USGS Rapid eDNA Assessment and Deployment Initiative and Network (READI-Net) project.
Red mangrove and brown pelicans
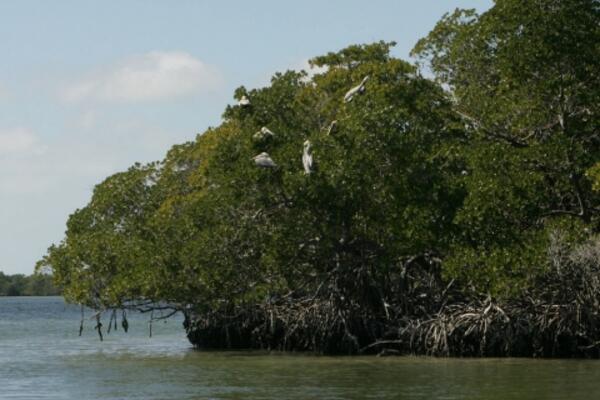
Red mangrove and brown pelicans at Ten Thousand Islands, Florida. Ecosystems are more than a static collection of plants and animals. An ecosystem is a dynamic set of processes that supports species and with which species interact. Ecosystems don’t just have structure, they have functions.
Red mangrove and brown pelicans at Ten Thousand Islands, Florida. Ecosystems are more than a static collection of plants and animals. An ecosystem is a dynamic set of processes that supports species and with which species interact. Ecosystems don’t just have structure, they have functions.
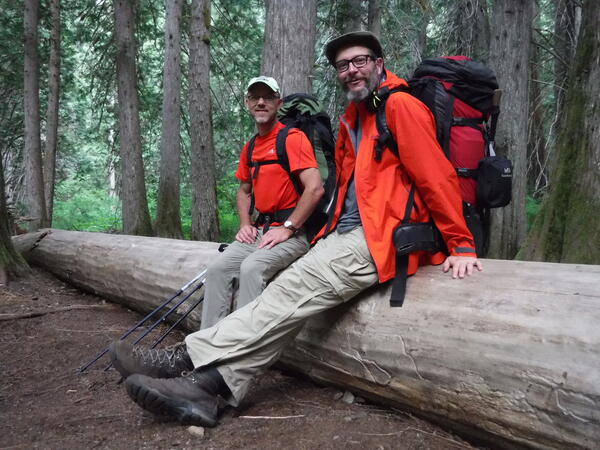
USGS Fisheries Scientists in Skagit County, WA
These are two USGS Western Fisheries Research Center scientists, Carl Ostberg and Jeff Duda (from left to right), sitting on a fallen tree in Skagit, WA. These scientists study critical fish, like salmon, in the Ross Dam reservoir and tributaries.
These are two USGS Western Fisheries Research Center scientists, Carl Ostberg and Jeff Duda (from left to right), sitting on a fallen tree in Skagit, WA. These scientists study critical fish, like salmon, in the Ross Dam reservoir and tributaries.
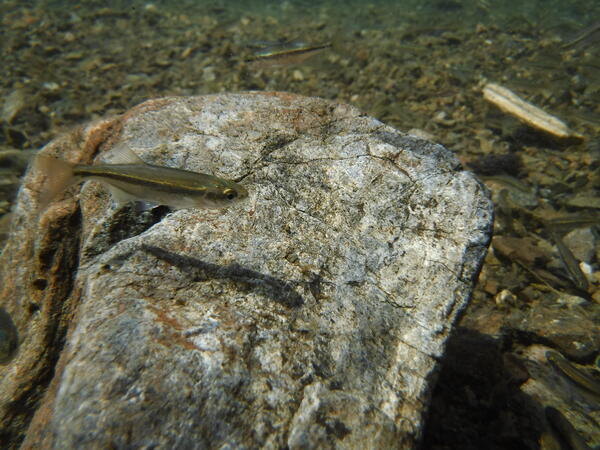
Redside Shiner Fish in Ross Lake, WA
This is a photo of a fish in Ross Lake, WA called the Redside Shiner. Ecologists at the Western Fisheries Research Center are studying this fish and the food web in Ross Lake.
This is a photo of a fish in Ross Lake, WA called the Redside Shiner. Ecologists at the Western Fisheries Research Center are studying this fish and the food web in Ross Lake.
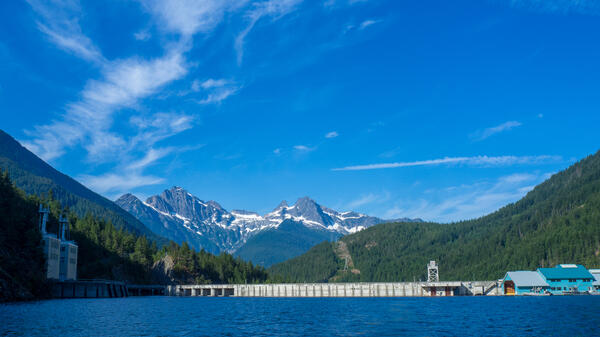
Ross Dam in Skagit, WA
This is a photo of Ross Dam as viewed from the boat. This photo was taken by fisheries scientists from the USGS Western Fisheries Research Center.
This is a photo of Ross Dam as viewed from the boat. This photo was taken by fisheries scientists from the USGS Western Fisheries Research Center.
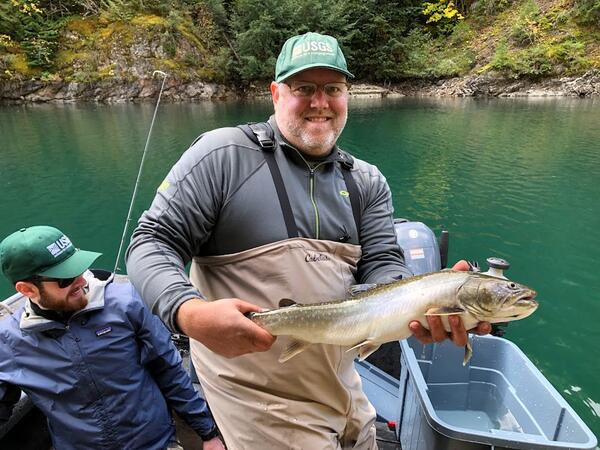
USGS Scientist Holding a Bull Trout in Ross Lake, WA
USGS Scientist Holding a Bull Trout in Ross Lake, WAThis is a photo of scientist, Marshal Hoy, holding a bull trout in Ross Lake. The USGS Western Fisheries Research Center does food web studies in Ross Lake to better understand the ecology and habitat for salmon in the area.
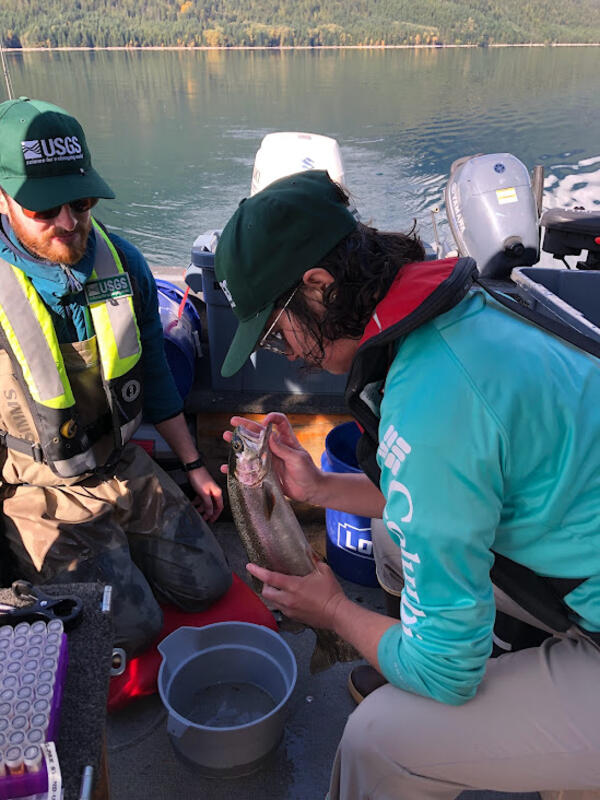
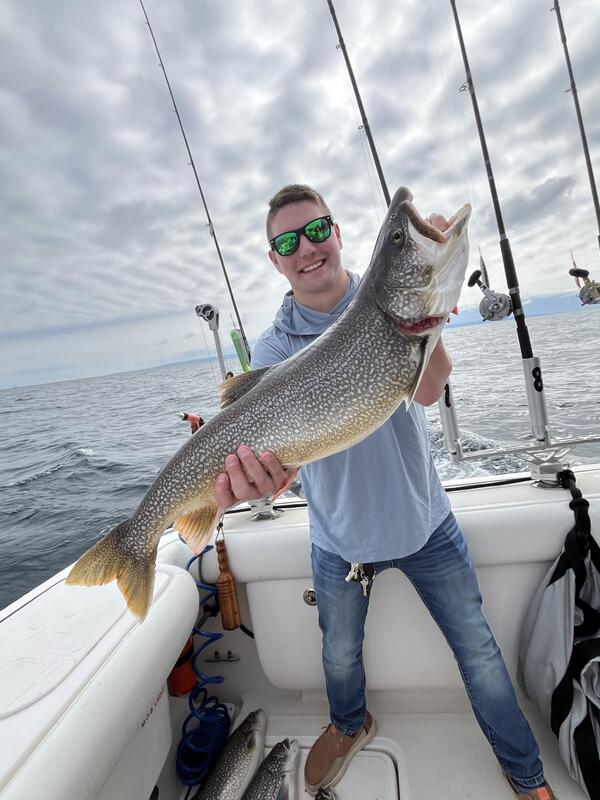
USGS Scientists Collecting Tissue Samples from a Rainbow Trout on Ross Lake.
USGS Scientists Collecting Tissue Samples from a Rainbow Trout on Ross Lake.This is a photo of scientists, Ben Jensen and Shelley Johnson, collecting tissue samples from a rainbow trout on Ross Lake. The USGS Western Fisheries Research Center does work on Ross Lake to understand the food web and ecology for salmon.