
Specimens from a USGS Lepidoptera Research Collection stored at the Kansas WSC Organic Geochemistry Reseearch Laboratory. Specimens are received as part of a Citizen Science effort to establish a collection to further insect research.
Images
See our science through the images below.
Filter Total Items: 3543

Lepidoptera Research Collection Specimens
Specimens from a USGS Lepidoptera Research Collection stored at the Kansas WSC Organic Geochemistry Reseearch Laboratory. Specimens are received as part of a Citizen Science effort to establish a collection to further insect research.
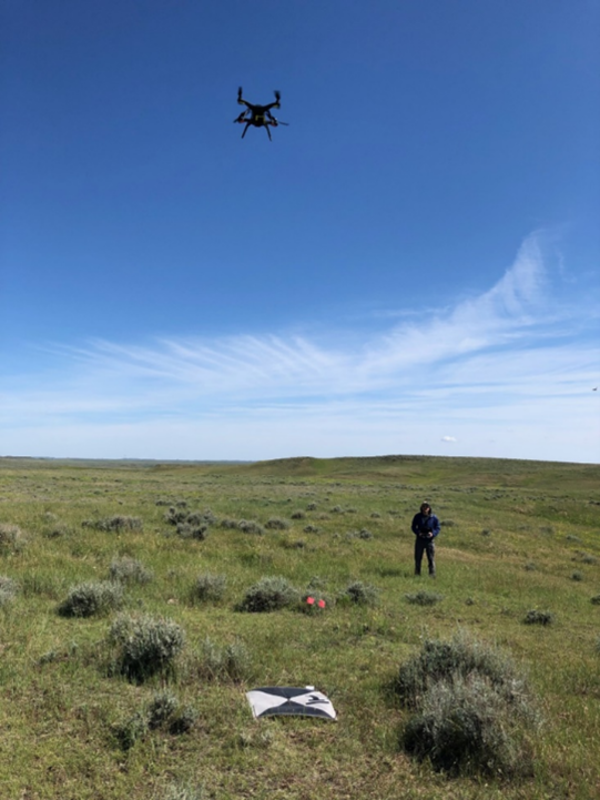
Researcher collecting data with unmanned aerial vehicle (drone)
Researcher collecting data with unmanned aerial vehicle (drone)USGS researchers acquire imagery from unmanned aerial vehicles (drones) synchronous with high-resolution imagery from satellites to map sagebrush across North Dakota and South Dakota.

Smallmouth Bass
Smallmouth Bass are good indicators of methylmercury exposure to humans and wildlife because they are a common, popular sport fish and eat a variety of food during their lifetime. Juvenile Smallmouth Bass – smaller than 150mm in length - eat zooplankton, or microscopic animals.
Smallmouth Bass are good indicators of methylmercury exposure to humans and wildlife because they are a common, popular sport fish and eat a variety of food during their lifetime. Juvenile Smallmouth Bass – smaller than 150mm in length - eat zooplankton, or microscopic animals.

How Climate Change Affects the Life Cycle of Monarch Butterflies
How Climate Change Affects the Life Cycle of Monarch ButterfliesDrawing showing climate change impacts to each life cycle stage of monarchs: 1) Butterflies lay fewer eggs in wetter conditions, 2) Warmer temperatures reduce milkweed growth, leaving caterpillars hungry, 3) Erratic winters freeze overwintering pupae, 4) Shifting seasons disrupt migrations.

Pipettes_5_23_23_JED.jpg
Image of pipettors used in the laboratory. Pipettes are stored on charging docking stations.
Image of pipettors used in the laboratory. Pipettes are stored on charging docking stations.

Surveying Prairie Potholes
Scientists survey prairie potholes in Wells County, North Dakota.
The Prairie Pothole Region extends across the central United States and Canada, providing wetland and grassland habitat to thousands of species, including critical breeding habitat for migratory waterbirds.
Scientists survey prairie potholes in Wells County, North Dakota.
The Prairie Pothole Region extends across the central United States and Canada, providing wetland and grassland habitat to thousands of species, including critical breeding habitat for migratory waterbirds.

Screenshot of USGS Wildfire Hazard and Risk Assessment Clearinghouse
Screenshot of USGS Wildfire Hazard and Risk Assessment ClearinghouseScreenshot of the USGS Wildfire Hazard and Risk Assessment Clearinghouse. The clearinghouse provides a description and information about the spatial extent, resolution, fire modeling approach, values considered (assets and resources), and vintage of LANDFIRE and fire dat
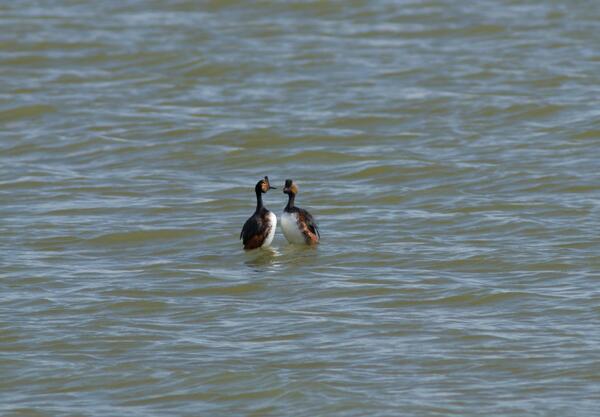
Eared grebes engaged in a courtship behavior
Eared grebes in a courtship behavior in the Great Salt Lake. They are one of many migratory birds in the Great Basin that rely on terminal lakes and wetlands in the area to stop rest and feed.
By
Ecosystems Mission Area, Water Resources Mission Area, Species Management Research Program, Forest and Rangeland Ecosystem Science Center, Fort Collins Science Center, Oregon Water Science Center, Utah Water Science Center, Western Ecological Research Center (WERC), Saline Lake Ecosystems Integrated Water Availability Assessment

Northern Arizona University graduate students monitor seedling emergence in a northern Arizona RestoreNet site
Northern Arizona University graduate students monitor seedling emergence in a northern Arizona RestoreNet siteNorthern Arizona University graduate students monitor seedling emergence in a northern Arizona RestoreNet site. Photo by Laura Shriver.

OGRL Instrument Room
Image shows equipment for analysis of targeted and non-targeted organic contaminants at the OGRL located at the KS WSC.
Image shows equipment for analysis of targeted and non-targeted organic contaminants at the OGRL located at the KS WSC.

A Northern Arizona University graduate student collects soil for RestoreNet greenhouse inoculation experiments
A Northern Arizona University graduate student collects soil for RestoreNet greenhouse inoculation experimentsNorthern Arizona University graduate student Ri Corwin collects soil for greenhouse inoculation experiments. Photo by Laura Shriver.

Loʻipūnāwai on the southern coast of Moloka‘i, Hawaiʻi
Loʻipūnāwai on the southern coast of Moloka‘i, HawaiʻiKaupapaloʻi o Kaʻamola

Fish, mussels, and passive samplers in an exposure tank housed inside of a mobile laboratory
Fish, mussels, and passive samplers in an exposure tank housed inside of a mobile laboratoryFathead minnows (Pimephales promelas), pond mussel (Ligumia subrostrata), and passive samplers in an exposure tank housed inside of a mobile laboratory at the legacy fire-training area contaminated by PFAS derived from aqueous film-forming foams on Cape Cod, Massachusetts.

Lepidoptera flier.JPG
Mail in deceased butterflies, moths, and skippers and help United States Geological Survey(USGS) scientists establish a Lepidoptera Research Collection (LRC). Specimens will help USGS scientists identify contaminants and environmental factors which may be contributing to the decline of insect populations.
Mail in deceased butterflies, moths, and skippers and help United States Geological Survey(USGS) scientists establish a Lepidoptera Research Collection (LRC). Specimens will help USGS scientists identify contaminants and environmental factors which may be contributing to the decline of insect populations.

Organic Geochemistry Research Laboratory, KS WSC
This is the instrument laboratory of the Organic Geochemistry Research Laboratory located in the KS WSC.
This is the instrument laboratory of the Organic Geochemistry Research Laboratory located in the KS WSC.
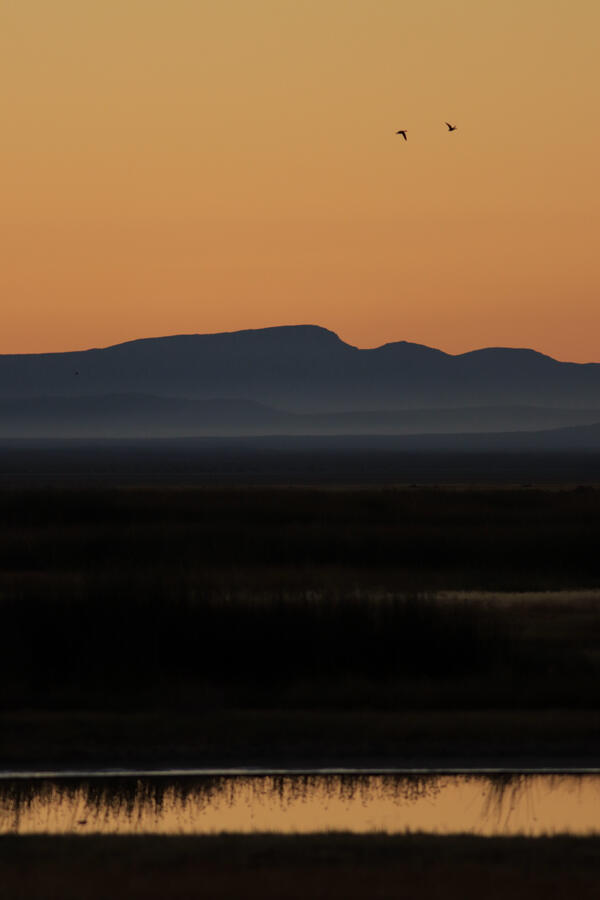
Summer Lake Wildlife Area
Photograph of Summer Lake Wildlife Area, an important stopping spot for migratory birds on their spring and fall migration flights.
By
Ecosystems Mission Area, Water Resources Mission Area, Species Management Research Program, Forest and Rangeland Ecosystem Science Center, Fort Collins Science Center, Nevada Water Science Center, Utah Water Science Center, Western Ecological Research Center (WERC), Saline Lake Ecosystems Integrated Water Availability Assessment

A close up of Sonoran Desert native wildflowers/forbs, including California poppy, lupines, and purple owl's clover
A close up of Sonoran Desert native wildflowers/forbs, including California poppy, lupines, and purple owl's cloverClose up of Sonoran Desert flowers, including California poppy, lupines, and purple owl's clover. Photo by Laura Shriver.

USGS researcher collecting data on a snow sample
Northern Rocky Mountain Science Center scientist examining a snow sample while standing in a snow pit to better understand snowpack characteristics that lead to avalanches.
Northern Rocky Mountain Science Center scientist examining a snow sample while standing in a snow pit to better understand snowpack characteristics that lead to avalanches.

Biologists from RAMPS and McDowell Sonoran Preserve monitor a RestoreNet site in the Sonoran Desert
Biologists from RAMPS and McDowell Sonoran Preserve monitor a RestoreNet site in the Sonoran DesertBiologists from RAMPS and McDowell Sonoran Preserve monitor a RestoreNet restoration site in the Sonoran Desert. Photo by Laura Shriver.

Sphaeralcea ambigua thriving at a Sonoran Desert RestoreNet site
Sphaeralcea ambigua thriving at a Sonoran Desert RestoreNet siteSphaeralcea ambigua, a native plant seeded during RestoreNet experiments, thriving at the Lake Pleasant RestoreNet site in the Sonoran Desert. Photo by Laura Shriver.
Sphaeralcea ambigua thriving at a Sonoran Desert RestoreNet site
Sphaeralcea ambigua thriving at a Sonoran Desert RestoreNet siteSphaeralcea ambigua, a native plant seeded during RestoreNet experiments, thriving at the Lake Pleasant RestoreNet site in the Sonoran Desert. Photo by Laura Shriver.

Purple owl's clover blooming at a Sonoran Desert RestoreNet site
Purple owl's clover blooming at a Sonoran Desert RestoreNet siteThe RestoreNet plot at McDowell Sonoran Preserve was surrounded by blooming native wildflowers, including purple owl's clover (Castillejia exserta). Photo by Laura Shriver.