Hydrographer provides a written description of a flagged high-water mark
Hydrographer provides a written description of a flagged high-water markA hydrographer providing a written description of a flagged high-water mark using a white board.

Official websites use .gov
A .gov website belongs to an official government organization in the United States.
Secure .gov websites use HTTPS
A lock () or https:// means you’ve safely connected to the .gov website. Share sensitive information only on official, secure websites.
This multimedia gallery represents a collection of high-quality images, videos, webcams, posters, presentations, and documents produced by the Water Resources Mission Area.
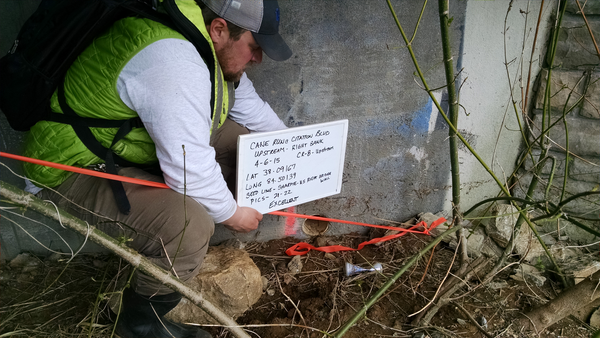
A hydrographer providing a written description of a flagged high-water mark using a white board.
A hydrographer providing a written description of a flagged high-water mark using a white board.
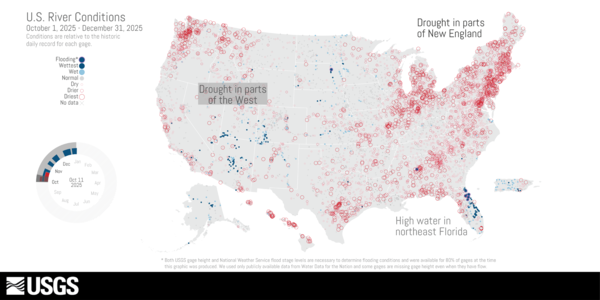
U.S. River Conditions, October to December 2025 thumbnail image. The river conditions shown range from the driest condition seen at a gage (red open circles) to the wettest (blue closed circles). A purple outer ring around a gage indicates it is flooding
U.S. River Conditions, October to December 2025 thumbnail image. The river conditions shown range from the driest condition seen at a gage (red open circles) to the wettest (blue closed circles). A purple outer ring around a gage indicates it is flooding

Image used for Instagram links for the USGS Water-themed Crossword Puzzles and solutions
Image used for Instagram links for the USGS Water-themed Crossword Puzzles and solutions
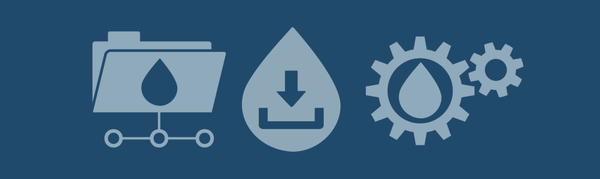
Images representing three of the services available to users of the National Water Availability Assessments (NWAA) Data Companion. Services include subset and download tool, data file directory, and web services.
Images representing three of the services available to users of the National Water Availability Assessments (NWAA) Data Companion. Services include subset and download tool, data file directory, and web services.
Video Description – October 2024 to September 2025
Video Description – October 2024 to September 2025
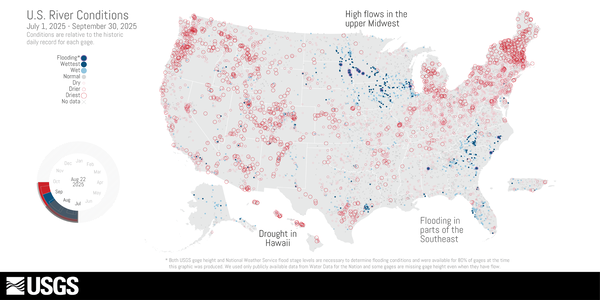
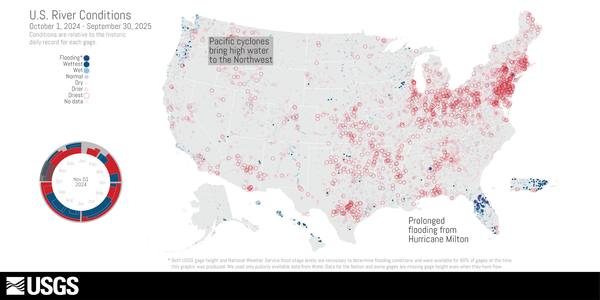
U.S. River Conditions, July to September 2025 thumbnail image. The river conditions shown range from the driest condition seen at a gage (red open circles) to the wettest (blue closed circles). A purple outer ring around a gage indicates it is flooding.
U.S. River Conditions, July to September 2025 thumbnail image. The river conditions shown range from the driest condition seen at a gage (red open circles) to the wettest (blue closed circles). A purple outer ring around a gage indicates it is flooding.

This recorded webinar demonstrates how to access and use new modeled water data delivered through the National Water Availability Assessment Data Companion (NWDC). The NWDC is a centralized website providing USGS model-derived water availability, supply, and use information that underlies the National Water Availability Assessment Report.
This recorded webinar demonstrates how to access and use new modeled water data delivered through the National Water Availability Assessment Data Companion (NWDC). The NWDC is a centralized website providing USGS model-derived water availability, supply, and use information that underlies the National Water Availability Assessment Report.
This is an animation showing the changing conditions relative to the historic record of USGS streamgages from October 1, 2024 - September 30, 2025. The river conditions shown range from the driest condition seen at a gage (red open circles) to the wettest (blue closed circles). A purple outer ring around a gage indicates it is flooding.
This is an animation showing the changing conditions relative to the historic record of USGS streamgages from October 1, 2024 - September 30, 2025. The river conditions shown range from the driest condition seen at a gage (red open circles) to the wettest (blue closed circles). A purple outer ring around a gage indicates it is flooding.
This is an animation showing the changing conditions relative to the historic record of USGS streamgages from July 1, 2025, to September 30, 2025. The river conditions shown range from the driest condition seen at a gage (red open circles) to the wettest (blue closed circles). A purple outer ring around a gage indicates it is flooding.
This is an animation showing the changing conditions relative to the historic record of USGS streamgages from July 1, 2025, to September 30, 2025. The river conditions shown range from the driest condition seen at a gage (red open circles) to the wettest (blue closed circles). A purple outer ring around a gage indicates it is flooding.

The USGS and D.C.’s DOEE have been working together to monitor water quality in the Anacostia, in support of the District's goal of expanding access to the water for local communities. DOEE relies on data and continuous monitoring from USGS to support important decisions about public safety and the accessibility of the area’s natural resources.
The USGS and D.C.’s DOEE have been working together to monitor water quality in the Anacostia, in support of the District's goal of expanding access to the water for local communities. DOEE relies on data and continuous monitoring from USGS to support important decisions about public safety and the accessibility of the area’s natural resources.

This is an animation showing the changing conditions relative to the historic record of USGS streamgages from April 1, 2025 to June 30, 2025. The river conditions shown range from the driest condition seen at a gage (red open circles) to the wettest (blue closed circles). A purple outer ring around a gage indicates it is flooding.
This is an animation showing the changing conditions relative to the historic record of USGS streamgages from April 1, 2025 to June 30, 2025. The river conditions shown range from the driest condition seen at a gage (red open circles) to the wettest (blue closed circles). A purple outer ring around a gage indicates it is flooding.

The USGS and D.C.’s DOEE have been working together to monitor water quality in the Anacostia, in support of the District's goal of expanding access to the water for local communities. DOEE relies on data and continuous monitoring from USGS to support important decisions about public safety and the accessibility of the area’s natural resources.
The USGS and D.C.’s DOEE have been working together to monitor water quality in the Anacostia, in support of the District's goal of expanding access to the water for local communities. DOEE relies on data and continuous monitoring from USGS to support important decisions about public safety and the accessibility of the area’s natural resources.
The St. Mary and Milk Rivers cross the U.S. and Canadian border and supply water to both countries. Managing that resource in the interest of both nations is a matter of international collaboration and cooperation, and Landsat data is helping offer objective information on water use.
The St. Mary and Milk Rivers cross the U.S. and Canadian border and supply water to both countries. Managing that resource in the interest of both nations is a matter of international collaboration and cooperation, and Landsat data is helping offer objective information on water use.
North Carolina, like many years before, is responding to flooding in the East and drought in the West. Holly Weyers, USGS North Carolina Water Science Center Director, discusses these extreme events.
North Carolina, like many years before, is responding to flooding in the East and drought in the West. Holly Weyers, USGS North Carolina Water Science Center Director, discusses these extreme events.
Groundwater is not a single vast pool of underground water; rather, it is contained within a variety of aquifer systems. Each of these aquifers has its own set of questions and challenges.
Groundwater is not a single vast pool of underground water; rather, it is contained within a variety of aquifer systems. Each of these aquifers has its own set of questions and challenges.
USGS North Carolina Data Chief, Jeanne Robbins, provides an overview on hydrologic data collection techniques for North Carolina.
USGS North Carolina Data Chief, Jeanne Robbins, provides an overview on hydrologic data collection techniques for North Carolina.
USGS North Carolina Water Quality Specialist Mary Georgino discusses The Triangle Area Water Supply Monitoring Project.
USGS North Carolina Water Quality Specialist Mary Georgino discusses The Triangle Area Water Supply Monitoring Project.
USGS North Carolina Water Science Center Director Jerad Bales discusses Hurricane Floyd and flood impacts on North Carolina in 1999.
USGS North Carolina Water Science Center Director Jerad Bales discusses Hurricane Floyd and flood impacts on North Carolina in 1999.
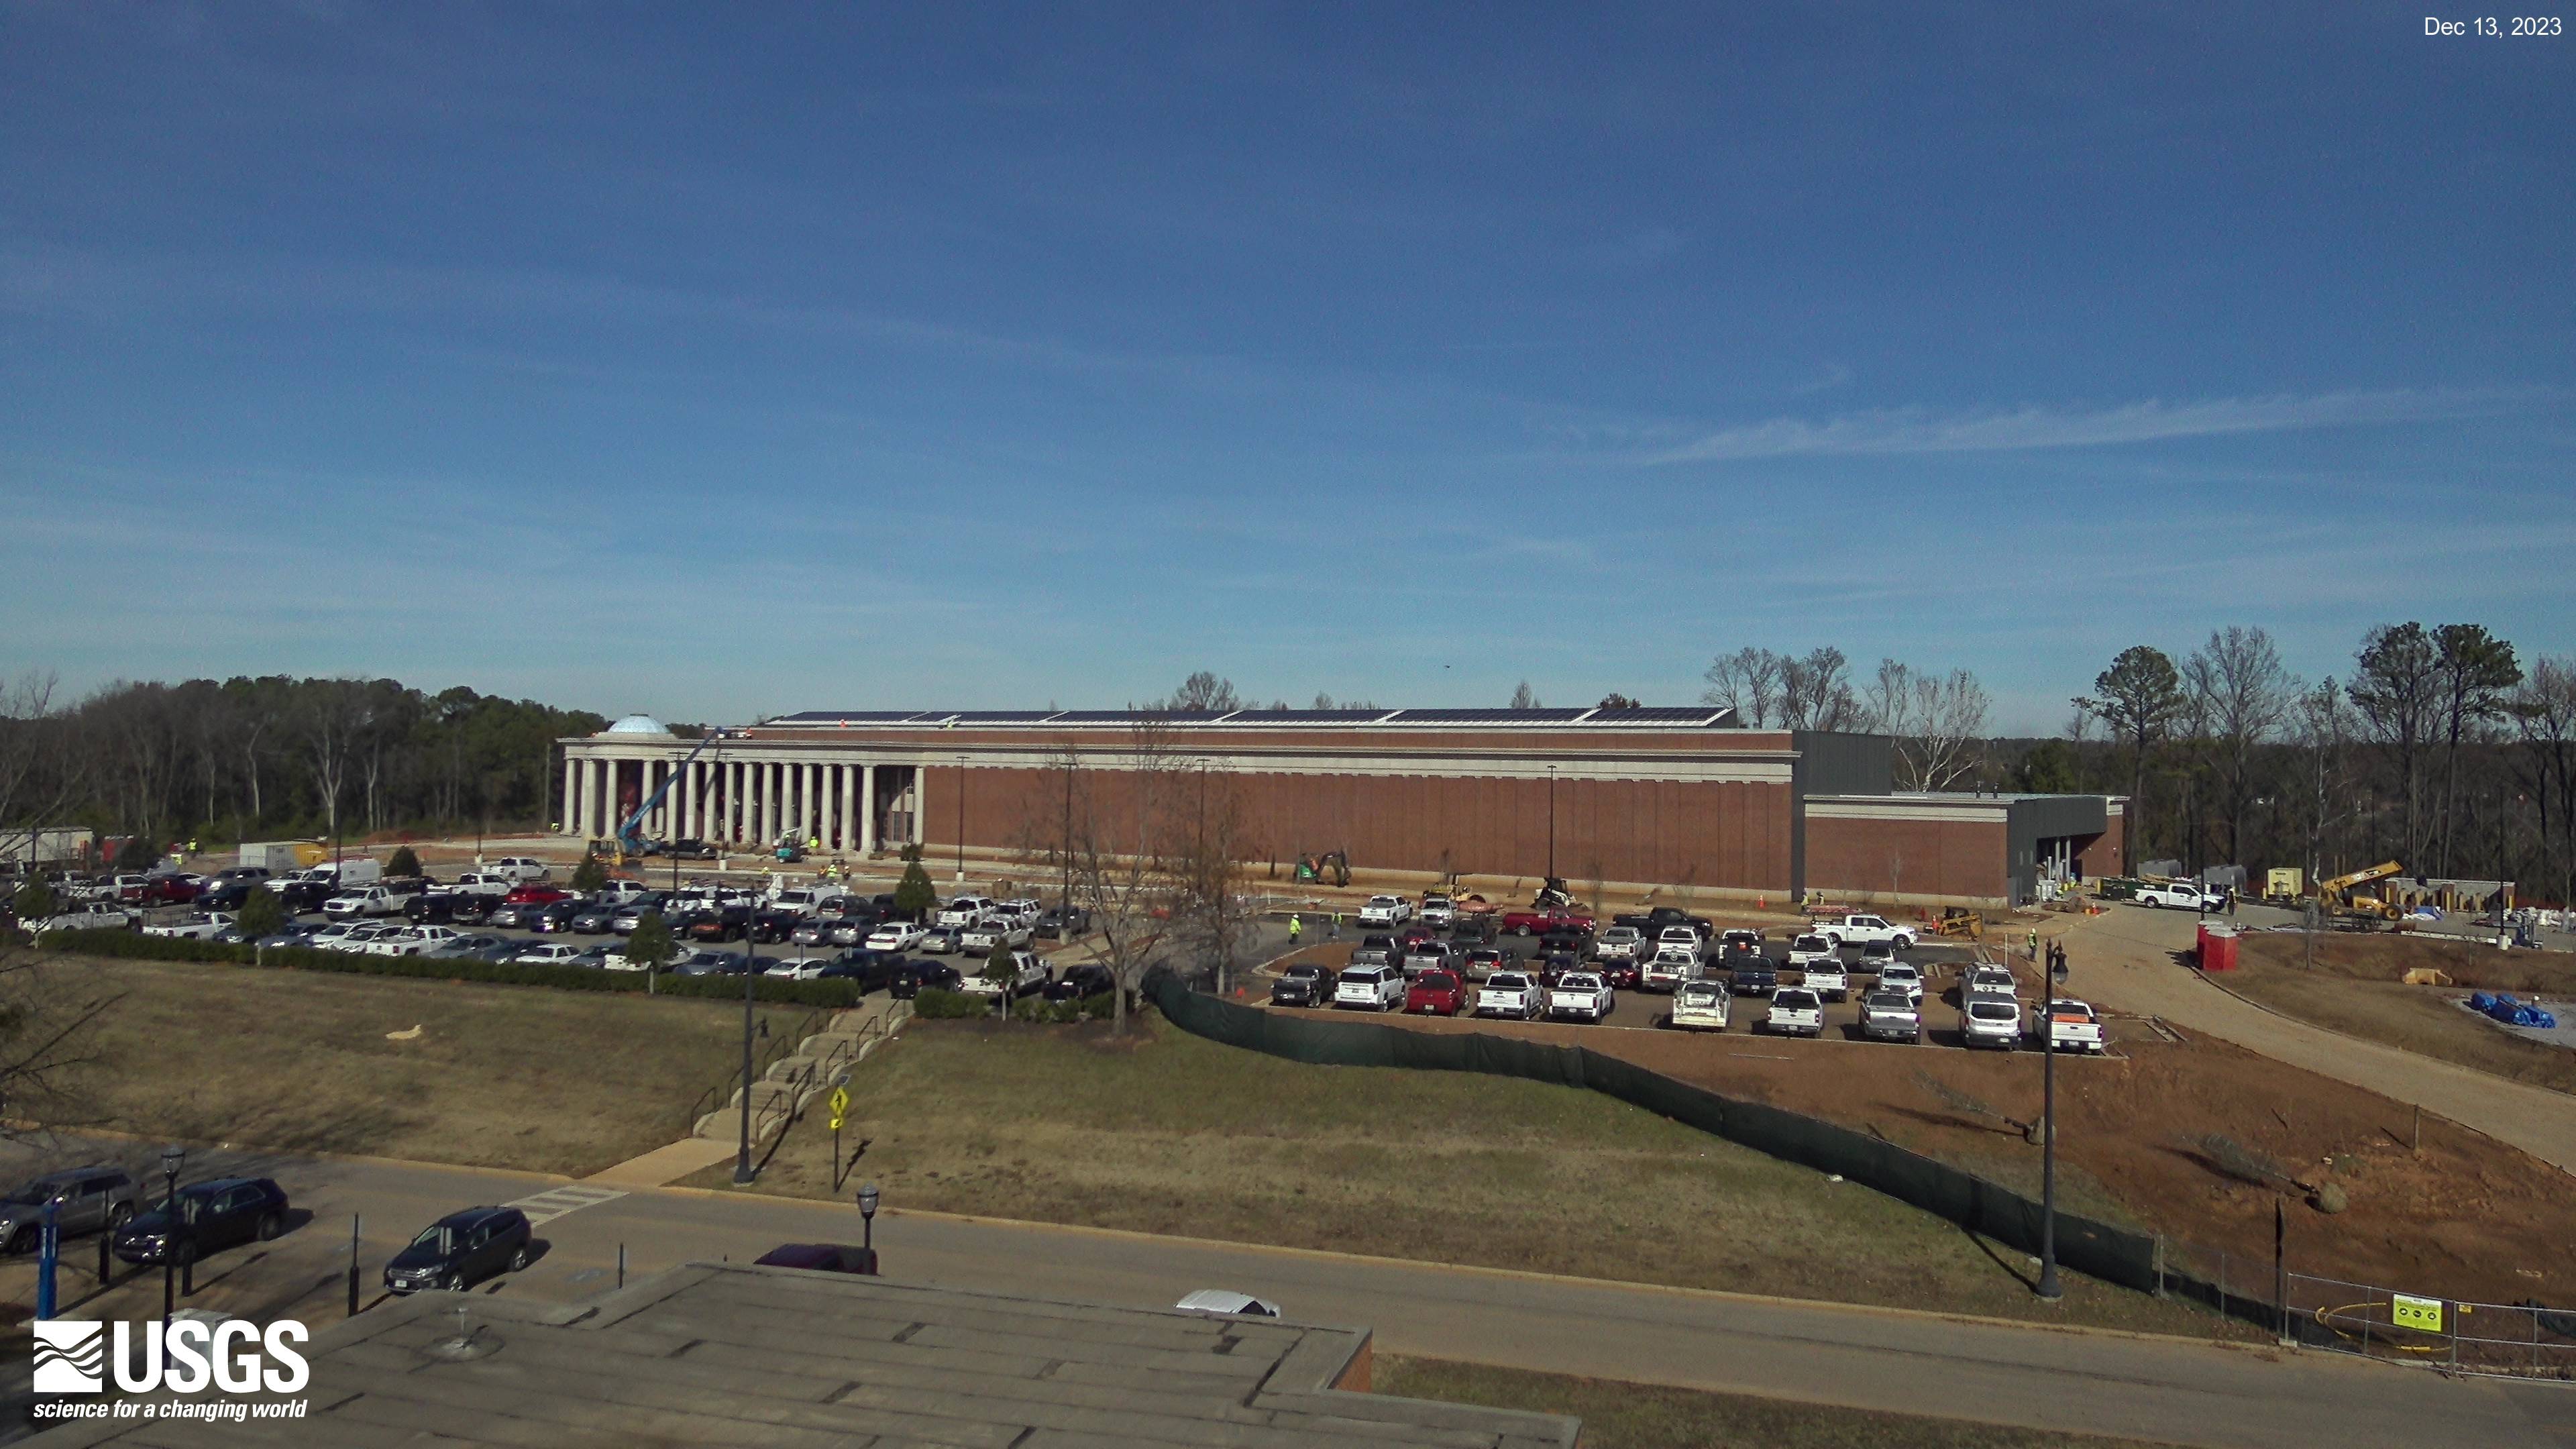
The current view of construction progress at the new HIF facility in Tuscaloosa, Alabama.
The current view of construction progress at the new HIF facility in Tuscaloosa, Alabama.
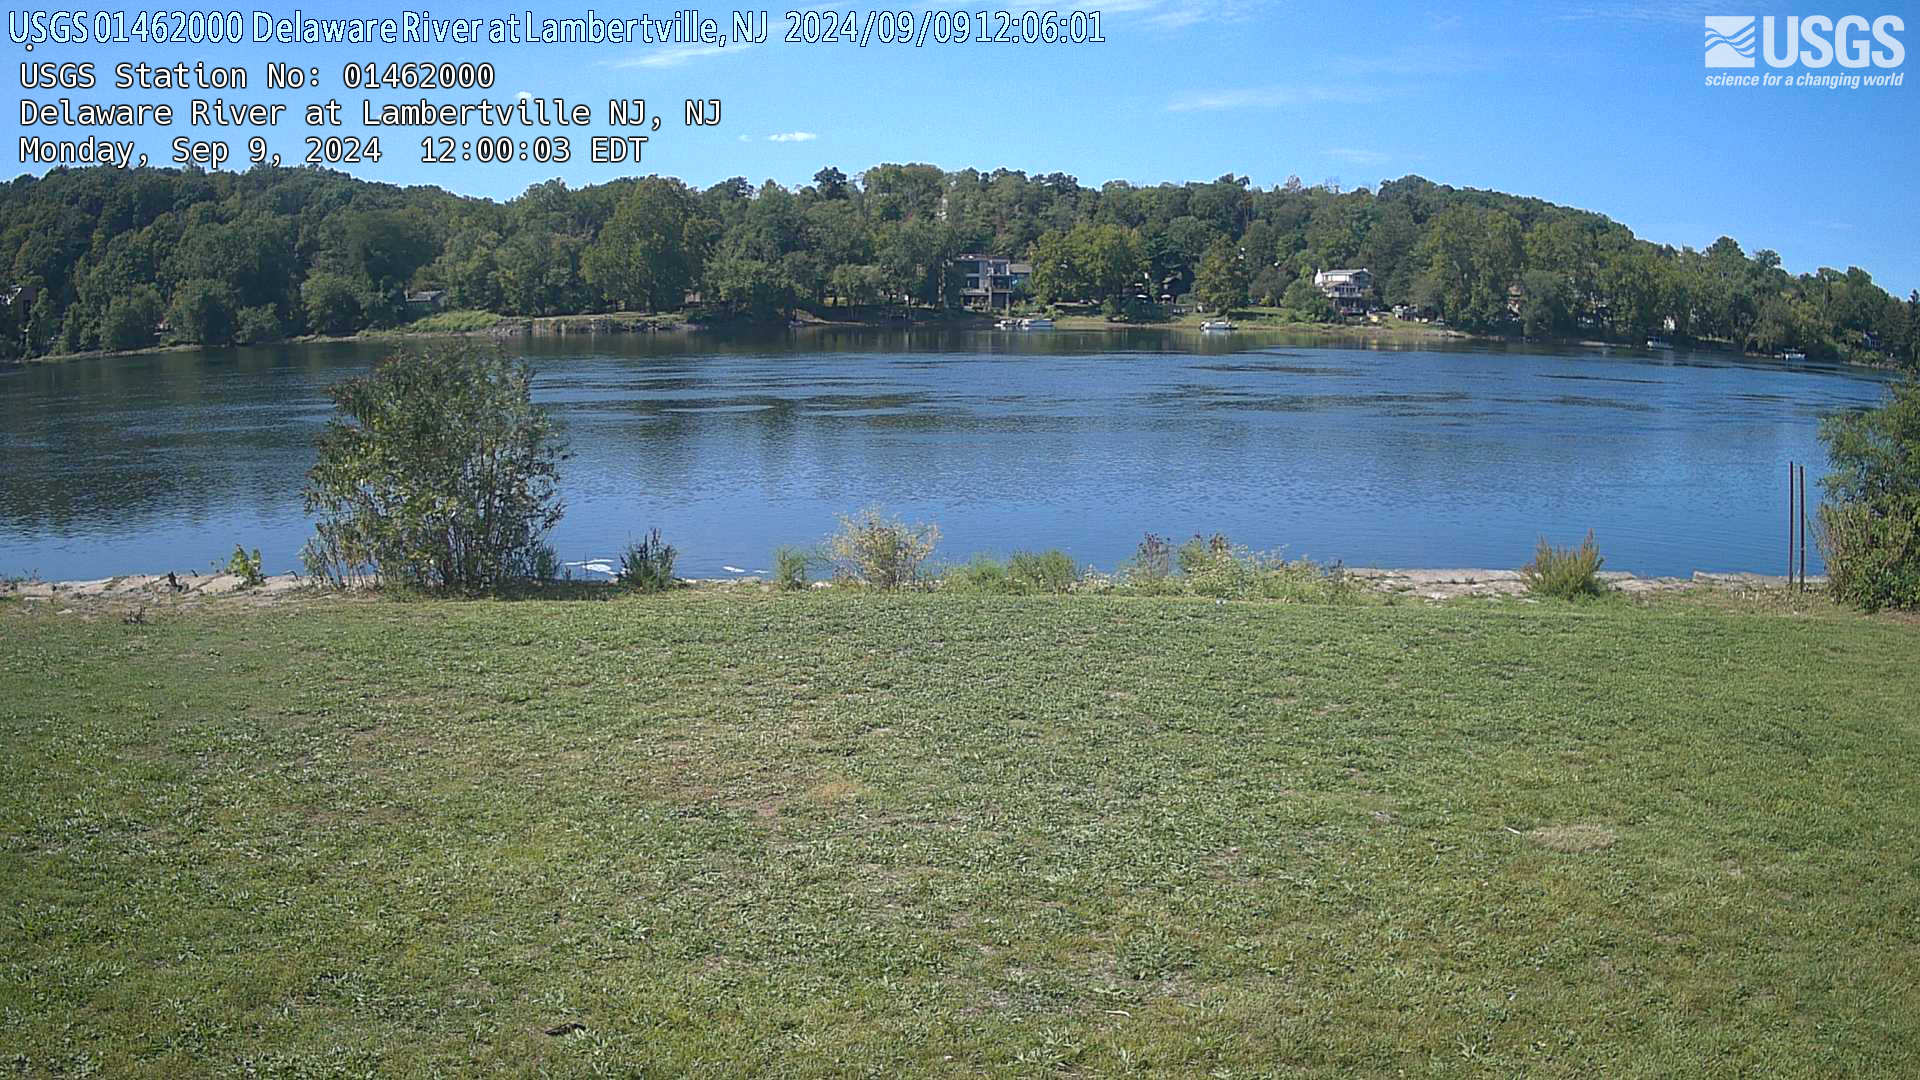
Webcam at USGS Streamgage 01462000 Delaware River at Lambertville, NJ.
Visit Water Data For the Nation to get current data for this site.
Webcam at USGS Streamgage 01462000 Delaware River at Lambertville, NJ.
Visit Water Data For the Nation to get current data for this site.
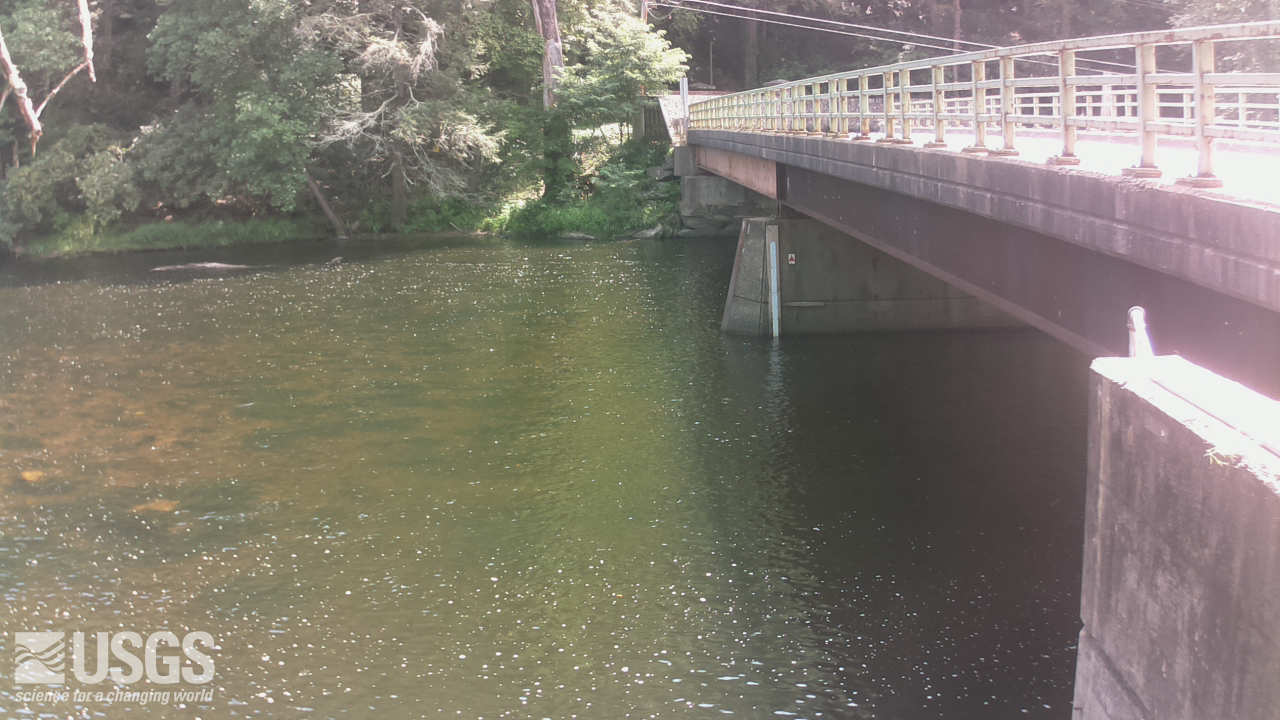
Webcam at USGS Streamgage 01437500 Neversink River at Godeffroy, NY.
Visit Water Data For the Nation to get current data for this site.
Webcam at USGS Streamgage 01437500 Neversink River at Godeffroy, NY.
Visit Water Data For the Nation to get current data for this site.

Webcam at USGS Streamgage 09095500 Colorado River near Cameo, CO.
Visit Water Data For the Nation to get current data for this site.
Webcam at USGS Streamgage 09095500 Colorado River near Cameo, CO.
Visit Water Data For the Nation to get current data for this site.

Webcam at USGS Streamgage 09071750 Colorado River above Glenwood Springs, CO.
Visit Water Data For the Nation to get current data for this site.
Webcam at USGS Streamgage 09071750 Colorado River above Glenwood Springs, CO.
Visit Water Data For the Nation to get current data for this site.
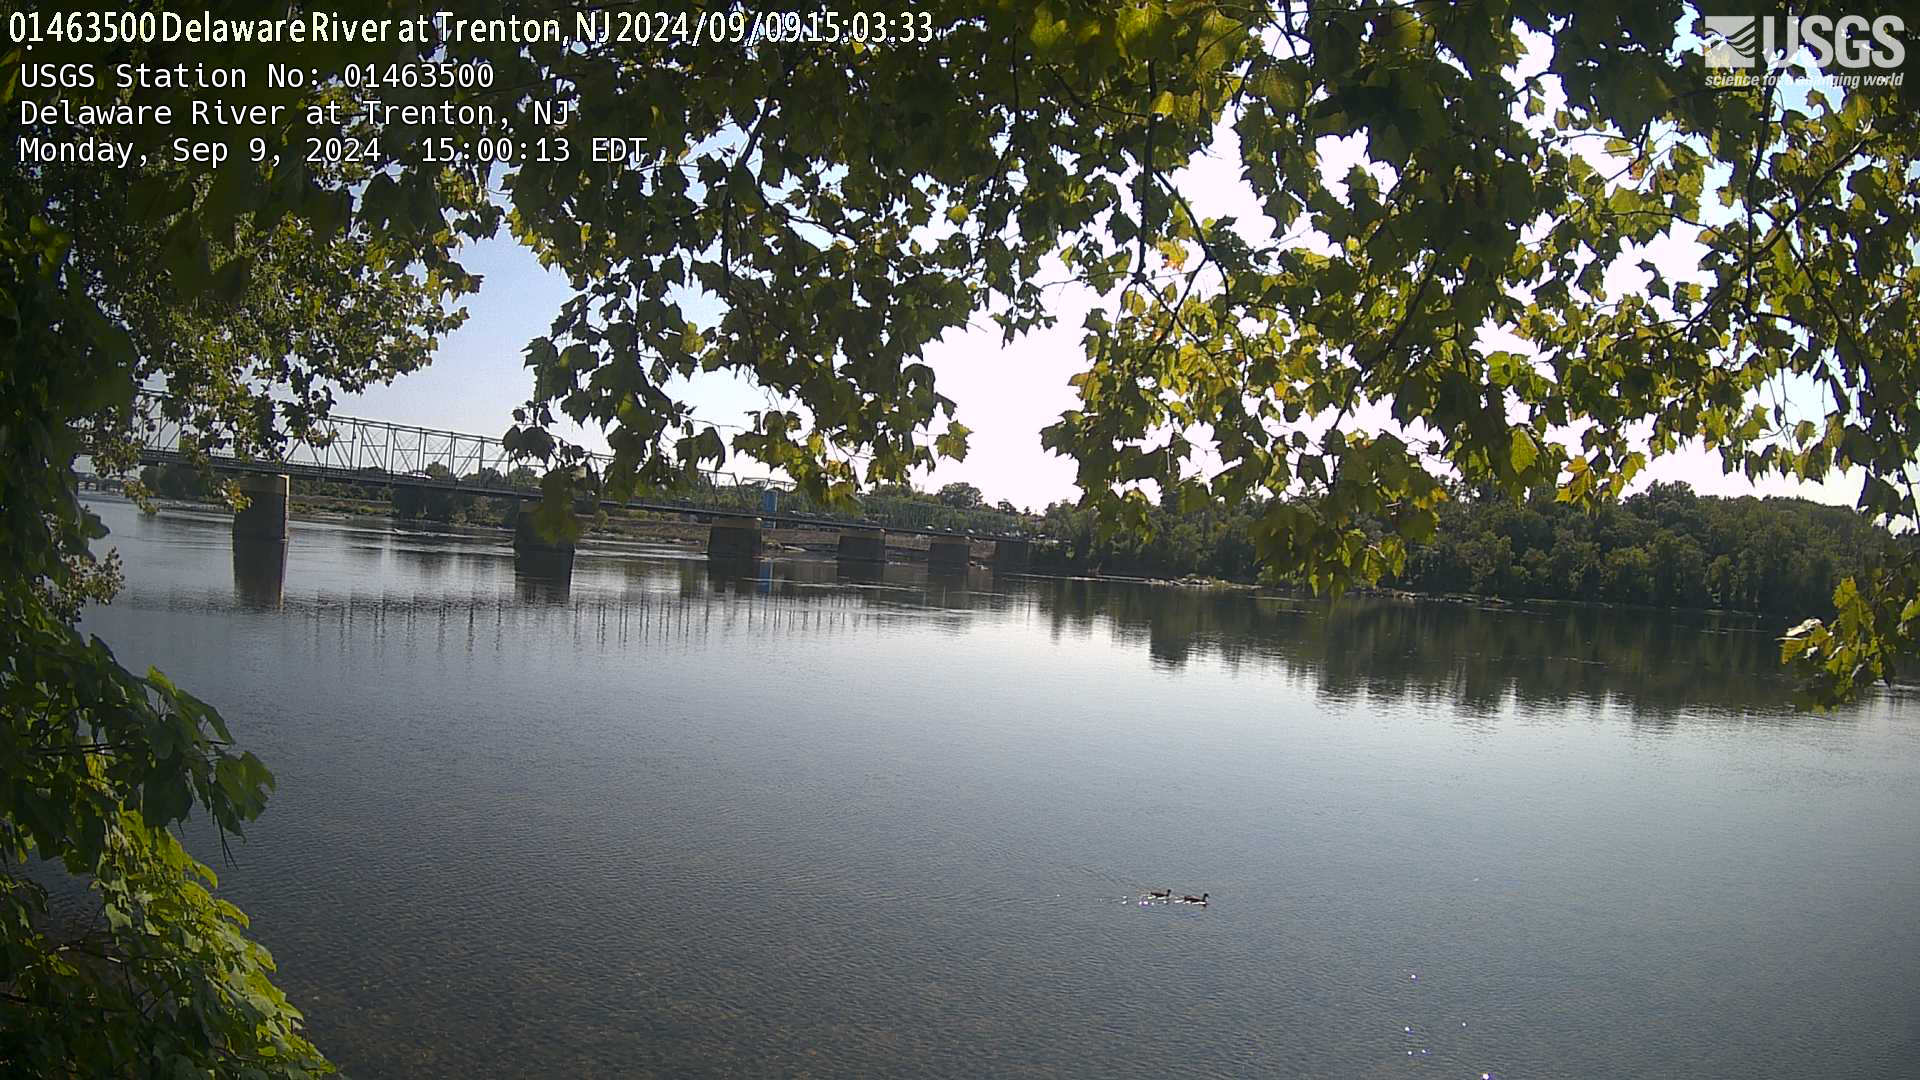
Webcam at USGS Streamgage 01463500 Delaware River at Trenton NJ.
Visit the site page to access data for this site.
Webcam at USGS Streamgage 01463500 Delaware River at Trenton NJ.
Visit the site page to access data for this site.


