
After Hurricane Ian, USGS scientist Scott Greenwood services the USGS streamgage on the St. Johns River near Sanford, Florida. Photograph taken October 6, 2022. Credit: Gene Grimm, USGS.
Images
Explore water-related photography, imagery, and illustrations.
Filter Total Items: 2533

USGS Science After Hurricane Ian
After Hurricane Ian, USGS scientist Scott Greenwood services the USGS streamgage on the St. Johns River near Sanford, Florida. Photograph taken October 6, 2022. Credit: Gene Grimm, USGS.

USGS Science After Hurricane Ian
After Hurricane Ian, USGS safety and occupational health specialist Sean Raabe retrieves a USGS storm surge sensor at Fernandina Beach, Florida. Photograph taken October 5, 2022. Credit: Hannah Flynn, USGS.
After Hurricane Ian, USGS safety and occupational health specialist Sean Raabe retrieves a USGS storm surge sensor at Fernandina Beach, Florida. Photograph taken October 5, 2022. Credit: Hannah Flynn, USGS.

USGS Science After Hurricane Ian
USGS hydrologic technician Megan Bock surveys high water marks from Hurricane Ian in Marineland, Florida. Photograph taken October 4, 2022. Credit: Fabian Kahn, USGS.
USGS hydrologic technician Megan Bock surveys high water marks from Hurricane Ian in Marineland, Florida. Photograph taken October 4, 2022. Credit: Fabian Kahn, USGS.

Gallinas Creek Montana Near Gage
Gallinas Creek watershed, NM in October 2022, after Hermits Peak/Calf Canyon fire (photo by Sheila Murphy, USGS)
Gallinas Creek watershed, NM in October 2022, after Hermits Peak/Calf Canyon fire (photo by Sheila Murphy, USGS)

USGS Science After Hurricane Ian
USGS safety and occupational health specialist Sean Raabe verifies the elevation of a USGS water level sensor in New Smyrna Beach, Florida. Photograph taken October 2, 2022. Credit: Hannah Flynn, USGS.
USGS safety and occupational health specialist Sean Raabe verifies the elevation of a USGS water level sensor in New Smyrna Beach, Florida. Photograph taken October 2, 2022. Credit: Hannah Flynn, USGS.

USGS Science After Hurricane Ian
USGS hydrologic technician Emily Robinson documents high water marks from Hurricane Ian on a house near Buckingham, Florida. Photograph taken October 2, 2022. Credit: Roberto Ravelo, USGS.
USGS hydrologic technician Emily Robinson documents high water marks from Hurricane Ian on a house near Buckingham, Florida. Photograph taken October 2, 2022. Credit: Roberto Ravelo, USGS.

September 2022 Streamflow
A tile map of the US showing streamgages by flow levels through the month of September. For each state, an area chart shows the proportion of streamgages in wet, normal, or dry conditions. Streamflow conditions are quantified using percentiles comparing the past month’s slow levels to the historic daily record for each streamgage.
A tile map of the US showing streamgages by flow levels through the month of September. For each state, an area chart shows the proportion of streamgages in wet, normal, or dry conditions. Streamflow conditions are quantified using percentiles comparing the past month’s slow levels to the historic daily record for each streamgage.
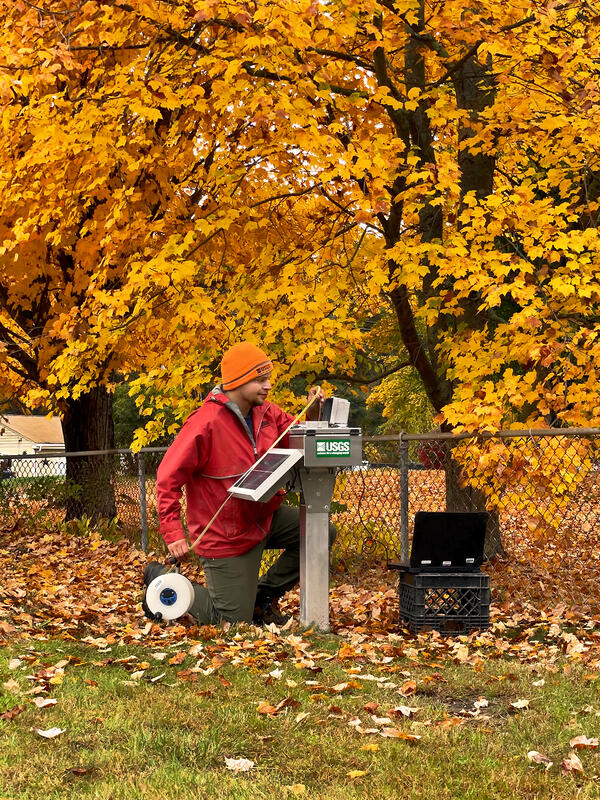
Climate Response Network site in Worcester County, Massachusetts
Climate Response Network site in Worcester County, MassachusettsUSGS scientist measures the groundwater level at a Climate Response Network monitoring well in Worcester County, Massachusetts (USGS station 422058072085101).
Climate Response Network site in Worcester County, Massachusetts
Climate Response Network site in Worcester County, MassachusettsUSGS scientist measures the groundwater level at a Climate Response Network monitoring well in Worcester County, Massachusetts (USGS station 422058072085101).

Installing Storm-tide Sensors for Hurricane Ian
Lukas Medo, a USGS hydrologic technician, installs a water-level sensor in Levy County, Florida, September 26, ahead of Hurricane Ian's landfall. Photo by Patrick Marasco, USGS.
Lukas Medo, a USGS hydrologic technician, installs a water-level sensor in Levy County, Florida, September 26, ahead of Hurricane Ian's landfall. Photo by Patrick Marasco, USGS.

Lone goose at sunrise at Summer Lake Wildlife Area
Lone goose at sunrise at Summer Lake Wildlife AreaLooking east on Bullgate Pond at sunrise with lone tule white-fronted goose (Anser albifrons elgasi) in upper right, Summer Lake Wildlife Area, near Summer Lake, Oregon.
By
Ecosystems Mission Area, Water Resources Mission Area, Species Management Research Program, Water Availability and Use Science Program, Forest and Rangeland Ecosystem Science Center, Fort Collins Science Center, Nevada Water Science Center, Oregon Water Science Center, Utah Water Science Center, Western Ecological Research Center (WERC), Saline Lake Ecosystems Integrated Water Availability Assessment

USGS Real-time Groundwater-Level Data at Mashpee, Massachusetts (Site 413525070291904)
USGS Real-time Groundwater-Level Data at Mashpee, Massachusetts (Site 413525070291904)USGS monitors groundwater levels at sites around the Nation. The location and frequency of water-level measurements depends on the objectives of the project or program for which the data are being collected.

How to Use NextGen WaterAlert
Watch our video on the USGS YouTube channel for how to use Next Generation WaterAlert to receive alerts for recent water conditions via text or email.
Watch our video on the USGS YouTube channel for how to use Next Generation WaterAlert to receive alerts for recent water conditions via text or email.

Scott Hamshaw
A photo of Scott Hamshaw. Scott is a Machine Learning Specialist in the Water Resources Mission Area of the U.S. Geological Survey.
A photo of Scott Hamshaw. Scott is a Machine Learning Specialist in the Water Resources Mission Area of the U.S. Geological Survey.

August 2022 Streamflow
A cartogram map of the US with proportional area charts for each state showing the proportion of streamgages by flow levels, categorized using percentile bins. Streamflow level percentiles are calculated using the historic daily record for each gage, and binned to reflect whether flow conditions are wetter or drier than the historical record.
A cartogram map of the US with proportional area charts for each state showing the proportion of streamgages by flow levels, categorized using percentile bins. Streamflow level percentiles are calculated using the historic daily record for each gage, and binned to reflect whether flow conditions are wetter or drier than the historical record.

Photograph of trees along the coast at Acadia National Park. Promotion for Recreate With USGS photo contest.
Photograph of trees along the coast at Acadia National Park. Promotion for Recreate With USGS photo contest.Photograph of trees along the coast at Acadia National Park. Promotion for Recreate With USGS campaign.
Steps to enter our photo contest
-
Take a photo while you’re out recreating on, in, or near water

USGS NGWOS Groundwater Wells, Mason County, Illinois
USGS NGWOS Groundwater Wells, Mason County, IllinoisThis August 2022 photo is of a new group (or “nest”) of groundwater wells that are part of a USGS Next Generation Water Observing System (NGWOS) project in the
USGS NGWOS Groundwater Wells, Mason County, Illinois
USGS NGWOS Groundwater Wells, Mason County, IllinoisThis August 2022 photo is of a new group (or “nest”) of groundwater wells that are part of a USGS Next Generation Water Observing System (NGWOS) project in the

Transitioning to NextGen WaterAlert in 3 simple steps
Transitioning to NextGen WaterAlert in 3 simple stepsOn August 24th at 1 pm ET/ 10 am PT we hosted a public webinar to guide users through the 3 steps necessary to transition from Legacy to Next Generation WaterAlert. Catch the recording on the USGS YouTube channel.

Johanna Blake at Gallinas Cr NM
USGS Gallinas Creek near Montezuma, NM (08380500) streamgaging and water-quality monitoring station in August 2022 (watershed burned by Calf Canyon/Hermit Peak Fires April-August 2022) (photo showing Johanna Blake, USGS; photo by Jeannie Barlow, USGS)
USGS Gallinas Creek near Montezuma, NM (08380500) streamgaging and water-quality monitoring station in August 2022 (watershed burned by Calf Canyon/Hermit Peak Fires April-August 2022) (photo showing Johanna Blake, USGS; photo by Jeannie Barlow, USGS)
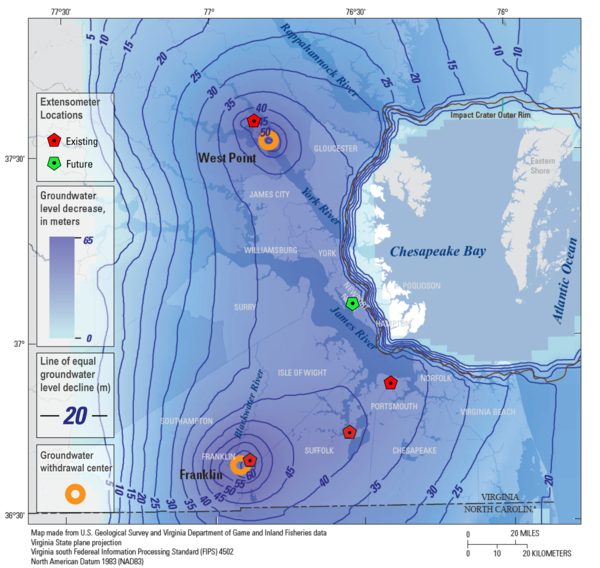
Virginia Extensometer Network
This map shows the locations of the four existing extensometers (red) in the USGS' Virginia Extensometer Network with the location of a fifth future extensometer (green). The basemap is of the Virginia Coastal Plain and shows the severity of groundwater depletion, with darker blue indicating greater groundwater depletion.
This map shows the locations of the four existing extensometers (red) in the USGS' Virginia Extensometer Network with the location of a fifth future extensometer (green). The basemap is of the Virginia Coastal Plain and shows the severity of groundwater depletion, with darker blue indicating greater groundwater depletion.

NextGen Update: Monitoring Location Pages & WaterAlert
NextGen Update: Monitoring Location Pages & WaterAlertThe thumbnail image for a video on NextGen Water Data for the Nation products.
NextGen Update: Monitoring Location Pages & WaterAlert
NextGen Update: Monitoring Location Pages & WaterAlertThe thumbnail image for a video on NextGen Water Data for the Nation products.

July 2022 Streamflow
A cartogram map of the US with proportional area charts for each state showing the proportion of streamgages by flow levels, categorized using percentile bins. Streamflow level percentiles are calculated using the historic daily record for each gage, and binned to reflect whether flow conditions are wetter or drier than the historical record.
A cartogram map of the US with proportional area charts for each state showing the proportion of streamgages by flow levels, categorized using percentile bins. Streamflow level percentiles are calculated using the historic daily record for each gage, and binned to reflect whether flow conditions are wetter or drier than the historical record.