
More than 1,500 walruses resting on shore at Cape Grieg in southeastern Bristol Bay.
Images
Explore our planet through photography and imagery, including climate change and water all the way back to the 1800s when the USGS was surveying the country by horse and buggy.
Filter Total Items: 21545

1,500 walruses resting on shore
More than 1,500 walruses resting on shore at Cape Grieg in southeastern Bristol Bay.

Measuring streamflow on Dry Piney Creek
Measuring streamflow on Dry Piney Creek
Measuring streamflow on Dry Piney Creek

Flow diagram of coal to coal-tar-pitch process
Coal tar is a byproduct of the coking, liquefaction, or gasification of coal. Coal-tar pitch is the residue that remains after the distillation of coal tar. Coal tar and coal-tar pitch are used in coal-tar-based sealcoat products, although use of coal-tar pitch is more common than use of coal tar. Both coal tar and coal-tar pitch are known human carcinogens.
Coal tar is a byproduct of the coking, liquefaction, or gasification of coal. Coal-tar pitch is the residue that remains after the distillation of coal tar. Coal tar and coal-tar pitch are used in coal-tar-based sealcoat products, although use of coal-tar pitch is more common than use of coal tar. Both coal tar and coal-tar pitch are known human carcinogens.

Mapping Cape Cod National Seashore using unmanned aerial systems
The USGS conducted UAS flights to map the Nauset Marsh and Coast Guard Beach areas of Cape Cod National Seashore on Tuesday, March 1, 2016. These are the first authorized UAS flights in the northeast region of the national park system, and were performed under a research permit according to FAA and DOI regulations.
The USGS conducted UAS flights to map the Nauset Marsh and Coast Guard Beach areas of Cape Cod National Seashore on Tuesday, March 1, 2016. These are the first authorized UAS flights in the northeast region of the national park system, and were performed under a research permit according to FAA and DOI regulations.
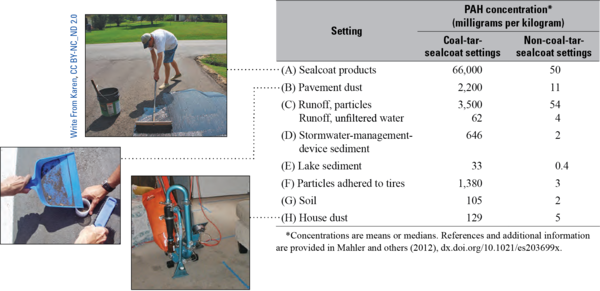
PAHs near pavement sealed or not sealed with coal-tar sealant
Concentrations of polycyclic aromatic hydrocarbons (PAHs) in settings near pavement sealed with coal-tar-based sealants were substantially higher than concentrations in settings where coal-tar sealant was not used.
Concentrations of polycyclic aromatic hydrocarbons (PAHs) in settings near pavement sealed with coal-tar-based sealants were substantially higher than concentrations in settings where coal-tar sealant was not used.

Preparing to measure water level in streambank piezometer, New Fork R
Preparing to measure water level in streambank piezometer, New Fork R
Preparing to measure water level in streambank piezometer, New Fork R

Stony Coral Tissue Loss Disease in Biscayne National Park
The Florida Keys reefs have been experiencing a severe disease outbreak from 2014 to present called Stony Coral Tissue Loss Disease (SCTLD).
The Florida Keys reefs have been experiencing a severe disease outbreak from 2014 to present called Stony Coral Tissue Loss Disease (SCTLD).
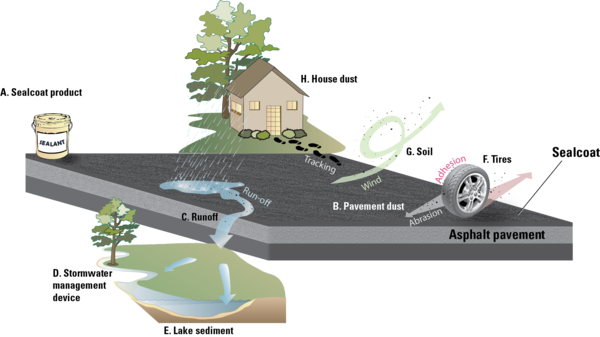
Transport pathways for PAHs from coal-tar-based sealcoat
Coal-tar-based sealcoat is a potent source of PAHs and related chemicals. Worn particles of coal-tar-based sealcoat are transported by rain, wind, tires, and even our feet from pavement to other environmental settings. Sealcoat product (A), after it dries, gradually abrades to a powder and becomes part of the dust on the pavement (B).
Coal-tar-based sealcoat is a potent source of PAHs and related chemicals. Worn particles of coal-tar-based sealcoat are transported by rain, wind, tires, and even our feet from pavement to other environmental settings. Sealcoat product (A), after it dries, gradually abrades to a powder and becomes part of the dust on the pavement (B).

View of Old Mans Creek near Iowa City, Iowa
View of Old Mans Creek near Iowa City, Iowa upstream from a bridge used for collecting water-quality samples (USGS Site ID: 05455100).
View of Old Mans Creek near Iowa City, Iowa upstream from a bridge used for collecting water-quality samples (USGS Site ID: 05455100).

Walker Lake
Walker Lake in Nevada on a Spring day
Walker Lake in Nevada on a Spring day

Boreal Chickadee with a mildly deformed beak
A Boreal Chickadee with a mildly deformed beak.
A Boreal Chickadee with a mildly deformed beak.

Lick Run concrete lined channel
View of the Lick Run concrete lined channel
View of the Lick Run concrete lined channel

USGS-CVO crew digs out Mount St. Helens' Sep. Lobe monitoring station.
During the first few days of Mount St. Helen's earthquake swarm in March 2016, the September Lobe monitoring station (located on the 1980-86 dome) was buried in deep snow and not transmitting data.
During the first few days of Mount St. Helen's earthquake swarm in March 2016, the September Lobe monitoring station (located on the 1980-86 dome) was buried in deep snow and not transmitting data.

School Branch at Brownsburg IN gage location
School Branch at Brownsburg IN gage location
School Branch at Brownsburg IN gage location

R/V Kaho
The R/V Kaho, based in Oswego, New York, operating on Lake Ontario during a recent cruise.
The R/V Kaho, based in Oswego, New York, operating on Lake Ontario during a recent cruise.

Rough skin newt just below the surface of a wetland pond
Rough skin newt just below the surface of a wetland pond in the Tualatin River Basin, Oregon.
Rough skin newt just below the surface of a wetland pond in the Tualatin River Basin, Oregon.

June 27th lava flow and steepest descent paths near Pāhoa, Kīlauea
This small-scale map shows Kīlauea's June2th lava flow boundaries on March 25, 2016, in relation to the eastern part of the Island of Hawai‘i. The area of the flow field on February 20 is shown in pink, while widening and advancement of the flow field as mapped on March 25 is shown in red. Pu‘u ‘Ō‘ō lava flows erupted prior to June 27, 2014, are shown in gray.
This small-scale map shows Kīlauea's June2th lava flow boundaries on March 25, 2016, in relation to the eastern part of the Island of Hawai‘i. The area of the flow field on February 20 is shown in pink, while widening and advancement of the flow field as mapped on March 25 is shown in red. Pu‘u ‘Ō‘ō lava flows erupted prior to June 27, 2014, are shown in gray.

Collecting Bathymetric Data
Physical scientist Jackson Currie steers a personal water craft (PWC) equipped with GPS and echo sounder through the waves of the nearshore area of Zmudowski State Beach in Moss Landing, California.
Physical scientist Jackson Currie steers a personal water craft (PWC) equipped with GPS and echo sounder through the waves of the nearshore area of Zmudowski State Beach in Moss Landing, California.

Black-throated Gray Warbler
Black-throated gray warbler at the HJ Andrews Experimental Forest in Oregon.
Black-throated gray warbler at the HJ Andrews Experimental Forest in Oregon.

Chesapeake Bay ospreys are healthy despite toxics in their fish diet
An adult osprey brings a fish to its nestlings at Poplar Island, Maryland. USGS researchers placed game cameras in some osprey nests to identify the types of fish that Chesapeake Bay ospreys are eating, then tested those fish species for toxic chemicals.
An adult osprey brings a fish to its nestlings at Poplar Island, Maryland. USGS researchers placed game cameras in some osprey nests to identify the types of fish that Chesapeake Bay ospreys are eating, then tested those fish species for toxic chemicals.

Hermit Warbler
Black-throated green warbler at the HJ Andrews Experimental Forest in Oregon.
Black-throated green warbler at the HJ Andrews Experimental Forest in Oregon.