Wildfires Scorch Large Swaths Along Oklahoma-Kansas Border
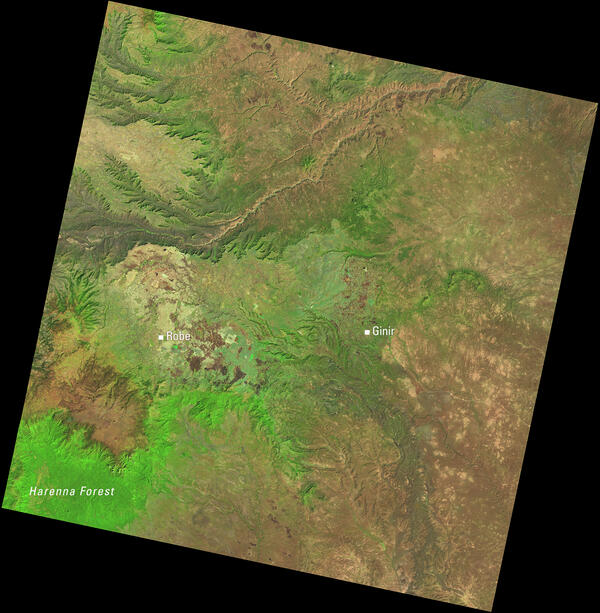
Wildfires Scorch Large Swaths Along Oklahoma-Kansas BorderUsing shortwave infrared, near infrared, and visible bands, these Landsat images provide a before and after look at the 350 Complex and Anderson Creek fires.