
This image also provides a clear view of the Juneau Icefield. Several glaciers flow from this icefield, and glaciologists are using the 42-year Landsat archive to monitor the advance and retreat of the glaciers over time.
Images
The National Land Imaging Program supports a variety of geospatial data programs and projects, including the USGS Landsat Program. Browse the images below to see some of the imagery produced using NLI-supported data sources.
Filter Total Items: 501

Juneau Icefield
This image also provides a clear view of the Juneau Icefield. Several glaciers flow from this icefield, and glaciologists are using the 42-year Landsat archive to monitor the advance and retreat of the glaciers over time.

Enhanced Landsat 8 Image of Western Australia
This image is a portion of the first Landsat 8 scene acquired May 12, 2013 (Path 107, Rows 70-71) in Western Australia. Geoscience Australia, a Landsat International Cooperator and a Landsat Science Team member, produced this enhanced image. Water and land were masked, separately enhanced, and then reassembled.
This image is a portion of the first Landsat 8 scene acquired May 12, 2013 (Path 107, Rows 70-71) in Western Australia. Geoscience Australia, a Landsat International Cooperator and a Landsat Science Team member, produced this enhanced image. Water and land were masked, separately enhanced, and then reassembled.

Landsat 7 Path 38 Row 31, Acquired March 29, 2013
On March 29-30, 2013, the Landsat Data Continuity Mission (later named Landsat 8) was in position under the Landsat 7 satellite. This provided opportunities for near-coincident data collection from both satellites.
On March 29-30, 2013, the Landsat Data Continuity Mission (later named Landsat 8) was in position under the Landsat 7 satellite. This provided opportunities for near-coincident data collection from both satellites.

Landsat 8 Path 38 Row 35, Acquired March 29, 2013
On March 29-30, 2013, the Landsat Data Continuity Mission (later named Landsat 8) was in position under the Landsat 7 satellite. This provided opportunities for near-coincident data collection from both satellites.
On March 29-30, 2013, the Landsat Data Continuity Mission (later named Landsat 8) was in position under the Landsat 7 satellite. This provided opportunities for near-coincident data collection from both satellites.

Landsat 7 Path 38 Row 35, Acquired March 29, 2013
On March 29-30, 2013, the Landsat Data Continuity Mission (later named Landsat 8) was in position under the Landsat 7 satellite. This provided opportunities for near-coincident data collection from both satellites.
On March 29-30, 2013, the Landsat Data Continuity Mission (later named Landsat 8) was in position under the Landsat 7 satellite. This provided opportunities for near-coincident data collection from both satellites.

Boulder, Colorado - Landsat 8
Landsat 8’s first image captured the area where the Great Plains and Rocky Mountains meet in Colorado in March 2013. The natural-color image shows the coniferous forest of the mountains coming down to the dormant plains. Boulder, Colorado, sits in the middle of the image.
Landsat 8’s first image captured the area where the Great Plains and Rocky Mountains meet in Colorado in March 2013. The natural-color image shows the coniferous forest of the mountains coming down to the dormant plains. Boulder, Colorado, sits in the middle of the image.

Landsat 5 MSS Image of Michigan’s Upper Peninsula
This image of Michigan’s Upper Peninsula was captured by the Multispectral Scanner (MSS) instrument onboard the Landsat 5 satellite on January 7, 2013.
This image of Michigan’s Upper Peninsula was captured by the Multispectral Scanner (MSS) instrument onboard the Landsat 5 satellite on January 7, 2013.

Remote Sensing Activities Report
Remote Sensing Activities Report front cover graphic for report.
Remote Sensing Activities Report front cover graphic for report.
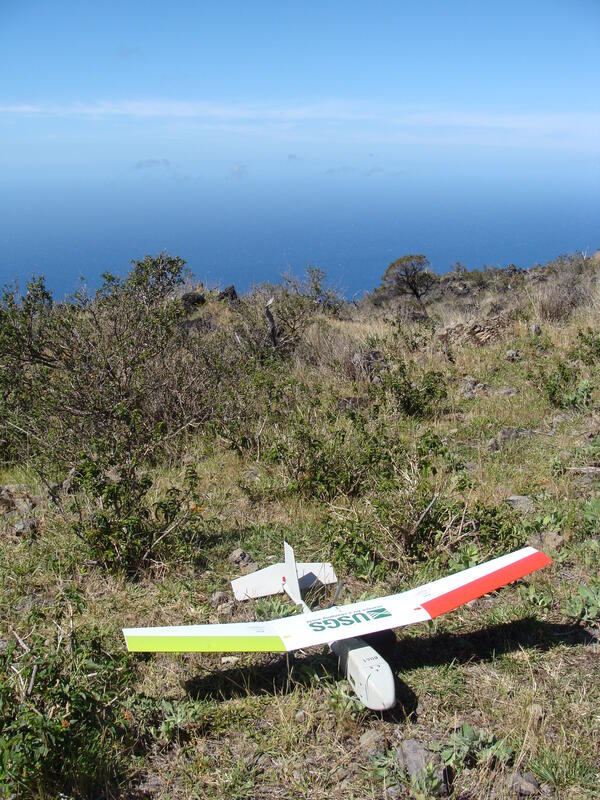
Fixed wing UAS at the Haleakala National Park in Hawaii
Fixed wing UAS at the Haleakala National Park in HawaiiFixed wing UAS at the Haleakala National Park in Hawaii in May 2012 where NUSO remote pilots worked with the National Park Service to test UAS’ ability to map invasive plants and inspect fence lines in remote inaccessible areas of the park.

Landsat 5 Captures MSS Data
The Multispectral Scanner (MSS) on board Landsat 5 satellite captured imagery of the southern Louisiana coastline on April 10, 2012, after the sensor was turned back on after being off for nearly a dozen years. This image is a portion of the scene from WRS-2 Path 23 Row 40. The MSS sensor collected nearly 15,000 scenes from 2012 to January 7, 2013.
The Multispectral Scanner (MSS) on board Landsat 5 satellite captured imagery of the southern Louisiana coastline on April 10, 2012, after the sensor was turned back on after being off for nearly a dozen years. This image is a portion of the scene from WRS-2 Path 23 Row 40. The MSS sensor collected nearly 15,000 scenes from 2012 to January 7, 2013.

USGS scientist hand launching a fixed wing UAS
USGS scientist Jeff Sloan hand launching a fixed wing UAS during a 2011 NUSO research mission, in coordination with the Office of Surface Mining, at the Powellton Surface Mine in West Virginia to test the utility of UAS technology for supporting coal mining inspection and oversight.
USGS scientist Jeff Sloan hand launching a fixed wing UAS during a 2011 NUSO research mission, in coordination with the Office of Surface Mining, at the Powellton Surface Mine in West Virginia to test the utility of UAS technology for supporting coal mining inspection and oversight.

Image of Landsat 8 over the US
This illustration shows the Landsat 8 satellite in space over the southeastern United States.
This illustration shows the Landsat 8 satellite in space over the southeastern United States.

Landsat Photo: Wallow Fire, Arizona
This Landsat imagery was taken on June 7, 2011. Path/Row: 35/36 and 37 Lat/Long: 33.820/-109.330
This Landsat imagery was taken on June 7, 2011. Path/Row: 35/36 and 37 Lat/Long: 33.820/-109.330

Tuscaloosa-Birmingham Tornado Scar, April 2011
The roughly west-east trail of destruction from the April 27, 2011, Tuscaloosa-Birmingham tornado is clearly visible in these Landsat images. This was one of 358 recorded tornadoes during the April 25-28, 2011, tornado outbreak, the most severe in U.S. history.
The roughly west-east trail of destruction from the April 27, 2011, Tuscaloosa-Birmingham tornado is clearly visible in these Landsat images. This was one of 358 recorded tornadoes during the April 25-28, 2011, tornado outbreak, the most severe in U.S. history.

Example of the Landsat Collection 2 Fractional Snow Covered Snow Science Product
Example of the Landsat Collection 2 Fractional Snow Covered Snow Science ProductExample of the Landsat Collection 2 Fractional Snow Covered Area (fSCA) Science Product showing an area in the Dixie National Forest in Utah on February 28, 2021 for tile h007V010. Left: Landsat Collection 2 U.S. Analysis Ready Data Surface Reflectance image, Middle: fSCA, and Right: Canopy Adjusted fSCA.

Illustration of the OLI instrument.
Illustration of the OLI Instrument.
Illustration of the OLI Instrument.

Tracking Nature's Cycles
Study of biological cycles.
Study of biological cycles.

Landsat Collection 2 Sample Data Example
Landsat 5 Thematic Mapper (TM) Collection 2 sample data example
Bands 5,4,3
Landsat 5 Thematic Mapper (TM) Collection 2 sample data example
Bands 5,4,3

Remnants of a spruce forest
Remnants of a spruce forest complex following a severe wildfire in the Yukon Flats National Wildlife Refuge, Alaska. Wildfires are the dominant landscape-scale disturbance operating at annual time scales in Alaska, and fires play a major role in the rate and extent of vegetation growth and productivity of a site.
Remnants of a spruce forest complex following a severe wildfire in the Yukon Flats National Wildlife Refuge, Alaska. Wildfires are the dominant landscape-scale disturbance operating at annual time scales in Alaska, and fires play a major role in the rate and extent of vegetation growth and productivity of a site.

Oil Spill in the Gulf of America- Landsat 7
On April 20, 2010, an explosion at an oil well in the Gulf of America resulted in a major oil spill. Since then, emergency response efforts have been underway to contain the growing oil slick before it reaches the southern coast of the United States. Landsat imagery, acquired by the U.S. Geological Survey on May 1 shows the extent of the oil slick.
On April 20, 2010, an explosion at an oil well in the Gulf of America resulted in a major oil spill. Since then, emergency response efforts have been underway to contain the growing oil slick before it reaches the southern coast of the United States. Landsat imagery, acquired by the U.S. Geological Survey on May 1 shows the extent of the oil slick.

Landsat 7 helps track Antarctica's emperor penguins
Landsat 7 helps track Antarctica's emperor penguinsSatellite image from Landsat 7 which was used to track Antarctica's emperor penguins.
Landsat 7 helps track Antarctica's emperor penguins
Landsat 7 helps track Antarctica's emperor penguinsSatellite image from Landsat 7 which was used to track Antarctica's emperor penguins.