
Annual NLCD land cover change product shows the change between the current year’s primary land cover and the prior year’s land cover when there is a change in primary class. The image shows an area around Marysville, WA.
Images
Peruse our selection of remote sensing and Earth science imagery below.
Filter Total Items: 864

Annual NLCD Land Cover Change cropped
Annual NLCD land cover change product shows the change between the current year’s primary land cover and the prior year’s land cover when there is a change in primary class. The image shows an area around Marysville, WA.

Annual NLCD Fractional Impervious Surface Cropped
Depicts the fractional surface area of the map unit (pixel) that is covered with artificial substrate or structures. The image shows an area around Marysville, WA.
Depicts the fractional surface area of the map unit (pixel) that is covered with artificial substrate or structures. The image shows an area around Marysville, WA.

Annual NLCD Fractional Impervious Surface
Depicts the fractional surface area of the map unit (pixel) that is covered with artificial substrate or structures in an area around Marysville, WA.
Depicts the fractional surface area of the map unit (pixel) that is covered with artificial substrate or structures in an area around Marysville, WA.

Annual NLCD Land Cover cropped
Annual NLCD generates a product suite of six land use and land cover themes from 1985-2023. The Annual NLCD Land Cover product Depicts the predominant thematic land cover class within the mapping year with respect to broad categories of artificial or natural surface cover. The image shows an area around Marysville, WA.
Annual NLCD generates a product suite of six land use and land cover themes from 1985-2023. The Annual NLCD Land Cover product Depicts the predominant thematic land cover class within the mapping year with respect to broad categories of artificial or natural surface cover. The image shows an area around Marysville, WA.
Annual NLCD Impervious Descriptor
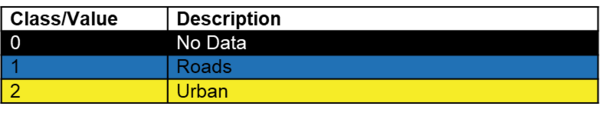
The Annual National Land Cover Database (NLCD) impervious descriptor product generates a raster layer that differentiates between urban and road surfaces.
The Annual National Land Cover Database (NLCD) impervious descriptor product generates a raster layer that differentiates between urban and road surfaces.

Annual NLCD Land Cover Change Legend
Annual National Land Cover Database (Annual NLCD) land cover legend contains 16 land cover classes based on the Anderson Level II classification system.
Annual National Land Cover Database (Annual NLCD) land cover legend contains 16 land cover classes based on the Anderson Level II classification system.

Annual NLCD Land Cover Change Legend
The Annual National Land Cover Database (NLCD) land cover change legend contains all of the annual NLCD land cover classes plus the land cover classification change classes. Annual NLCD Land Cover Change land cover change product contains a total of 241 land cover classes.
The Annual National Land Cover Database (NLCD) land cover change legend contains all of the annual NLCD land cover classes plus the land cover classification change classes. Annual NLCD Land Cover Change land cover change product contains a total of 241 land cover classes.

Annual NLCD Land Cover Change
Annual NLCD land cover change product shows the change between the current year’s primary land cover and the prior year’s land cover when there is a change in primary class. The area shown is around Marysville, WA.
Annual NLCD land cover change product shows the change between the current year’s primary land cover and the prior year’s land cover when there is a change in primary class. The area shown is around Marysville, WA.

Annual NLCD Impervious Descriptor
The Annual National Land Cover Database (NLCD) impervious descriptor product generates a raster layer that differentiates between urban and road surfaces. The area depicted is around Marysville, WA
The Annual National Land Cover Database (NLCD) impervious descriptor product generates a raster layer that differentiates between urban and road surfaces. The area depicted is around Marysville, WA

Annual NLCD Impervious Descriptor cropped
The Annual National Land Cover Database (NLCD) impervious descriptor product generates a raster layer that differentiates between urban and road surfaces. The image shows an area around Marysville, WA.
The Annual National Land Cover Database (NLCD) impervious descriptor product generates a raster layer that differentiates between urban and road surfaces. The image shows an area around Marysville, WA.

Land cover change in the northern Dallas-Fort Worth area from 1985-2023 as shown by Annual NLCD Collection 1.0
Land cover change in the northern Dallas-Fort Worth area from 1985-2023 as shown by Annual NLCD Collection 1.0An animation of images from the Annual National Land Cover Database (NLCD) for every year from 1985 through 2023 showing land cover changes and the progression of growth of urban areas (in red) in the northern Dallas-Fort Worth, Texas, metropolitan area.

An Annual NLCD Land Cover map centered are around Lake Stevens, WA
An Annual NLCD Land Cover map centered are around Lake Stevens, WAAn Annual NLCD Land Cover map of centered around Lake Stevens, WA depicting 16 land cover classes.
An Annual NLCD Land Cover map centered are around Lake Stevens, WA
An Annual NLCD Land Cover map centered are around Lake Stevens, WAAn Annual NLCD Land Cover map of centered around Lake Stevens, WA depicting 16 land cover classes.

Annual NLCD Collection 1.0 (2023) for CONUS
The Annual NLCD product suite offers six different land use and land cover products. The Annual NLCD Land Cover product depicts the predominant thematic land cover of 16 Anderson Level II classes within the current mapping year. The Annual NLCD Land Cover of the conterminous United States shows all Anderson Level II classes.
The Annual NLCD product suite offers six different land use and land cover products. The Annual NLCD Land Cover product depicts the predominant thematic land cover of 16 Anderson Level II classes within the current mapping year. The Annual NLCD Land Cover of the conterminous United States shows all Anderson Level II classes.

West and East eVIIRS Remote Sensing Phenology - SOST for 2023
West and East eVIIRS Remote Sensing Phenology - SOST for 2023Western and Eastern region eVIIRS Remote Sensing Phenology Start of Season for 2023.
West and East eVIIRS Remote Sensing Phenology - SOST for 2023
West and East eVIIRS Remote Sensing Phenology - SOST for 2023Western and Eastern region eVIIRS Remote Sensing Phenology Start of Season for 2023.

Spatial Distributions of Reference Sample
To assess the accuracy of Annual NLCD, Collection 1.0, a team of image interpreters review Landsat imagery, high resolution aerial photography, and other supporting data to make annual land cover classifications for thousands of 30-meter by 30-meter plot locations for the full 1985-2023 time series. This process is broken down into two phases.
To assess the accuracy of Annual NLCD, Collection 1.0, a team of image interpreters review Landsat imagery, high resolution aerial photography, and other supporting data to make annual land cover classifications for thousands of 30-meter by 30-meter plot locations for the full 1985-2023 time series. This process is broken down into two phases.

Forest Cutting in Ouachita Mountains
Clearcutting in a forest in the Ouachita Mountains of Arkansas and Oklahoma. Heavy machinery is being used to cut trees and haul lumber away to another location.
Clearcutting in a forest in the Ouachita Mountains of Arkansas and Oklahoma. Heavy machinery is being used to cut trees and haul lumber away to another location.

Rangeland Condition Monitoring, Assessment, and Projection (RCMAP) provides critical information on subtle vegetation changes in western US rangelands.
Rangeland Condition Monitoring, Assessment, and Projection (RCMAP) provides critical information on subtle vegetation changes in western US rangelands.Rangeland managers need information on the current vegetation condition and how the landscape has changed through time. To address this need, scientsist from the USGS and Bureau of Land Management (BLM) developed the Rangeland Condition Monitoring Assessment and Projection (RCMAP) project. These data classify U.S.
Rangeland Condition Monitoring, Assessment, and Projection (RCMAP) provides critical information on subtle vegetation changes in western US rangelands.
Rangeland Condition Monitoring, Assessment, and Projection (RCMAP) provides critical information on subtle vegetation changes in western US rangelands.Rangeland Condition Monitoring, Assessment, and Projection (RCMAP) provides critical information on subtle vegetation changes in western US rangelands.
Rangeland Condition Monitoring, Assessment, and Projection (RCMAP) provides critical information on subtle vegetation changes in western US rangelands.Rangeland managers need information on the current vegetation condition and how the landscape has changed through time. To address this need, scientsist from the USGS and Bureau of Land Management (BLM) developed the Rangeland Condition Monitoring Assessment and Projection (RCMAP) project. These data classify U.S.

Annual NLCD Land Cover Change Project
A map generated by 2023 Annual National Land Cover Database (Annual NLCD) depicting the different land cover classes.
A map generated by 2023 Annual National Land Cover Database (Annual NLCD) depicting the different land cover classes.

Landsat Images of the Park Fire, July 2024
The Park Fire north of Sacramento in California forced thousands of residents to evacuate in late July as it spread to over 370,000 acres. The fire started on July 24th. Landsat 8 captured an image of the fire two days later.
The Park Fire north of Sacramento in California forced thousands of residents to evacuate in late July as it spread to over 370,000 acres. The fire started on July 24th. Landsat 8 captured an image of the fire two days later.
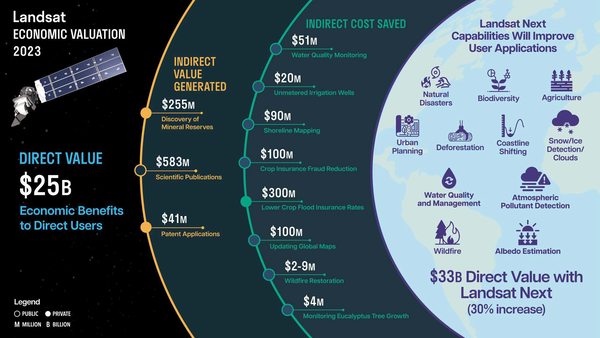
Infographic for Report "Economic Valuation of Landsat and Landsat Next 2023"
Infographic for Report "Economic Valuation of Landsat and Landsat Next 2023"This infographic is from the report "Economic Valuation of Landsat and Landsat Next 2023," which shows that Landsat's direct value in 2023 was \$25.6 billion. The report and infographic also show well over \$1 billion in estimated indirect economic value.

JACIE 2025 Workshop Save the Date
JACIE 2025 will be held April 7 - 11, 2025 at USGS Headquarters in Reston, Virginia.
Annual JACIE Workshops are sponsored by government agencies and allow remote sensing experts to discuss system capabilities, calibration, and the impacts of data quality on various applications.
Highlights of JACIE Workshops include: