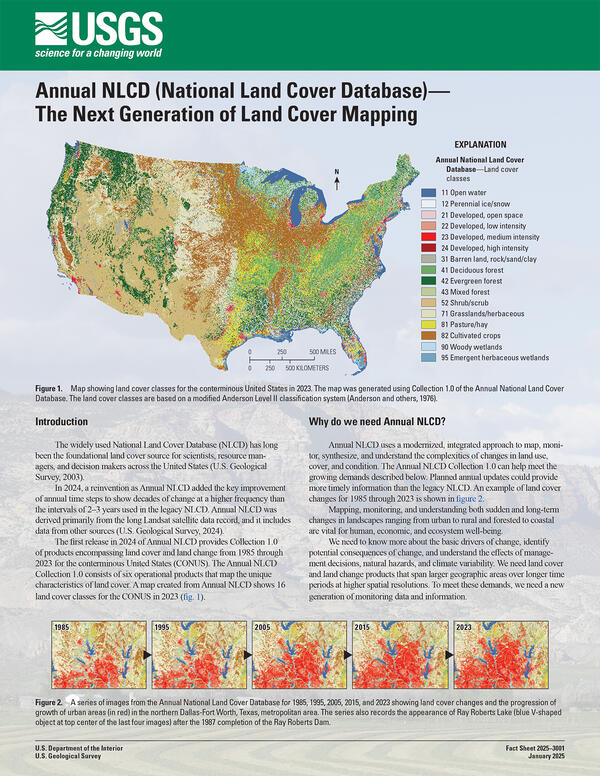
The Chesapeake Bay watershed has experienced substantial population growth over the last several decades. Since 1950, the population has more than doubled, and between 1980 and 2023, the number increased from 12.7 million to 18.6 million.
Images
Peruse our selection of remote sensing and Earth science imagery below.
The Chesapeake Bay watershed has experienced substantial population growth over the last several decades. Since 1950, the population has more than doubled, and between 1980 and 2023, the number increased from 12.7 million to 18.6 million.
Landsat Level-2 Provisional Aquatic Reflectance of the Chesapeake Bay
Landsat Level-2 Provisional Aquatic Reflectance of the Chesapeake BayThe Chesapeake Bay watershed spans more than 64,000 square miles (166,000 square kilometers) and encompasses parts of six states—Delaware, Maryland, New York, Pennsylvania, Virginia, and West Virginia—and the District of Columbia.
A bird’s eye view of the Thacker Pass lithium mine captured in late February 2025 reveals the contours of the process plant pad taking shape. Lithium Americas, the company that owns the mine, used Landsat data to help determine its potential impact on sagebrush environments and groundwater.
On Tuesday, January 21, 2025, Winter Storm Enzo brought an exceptionally rare snowfall to the Greater Houston metro area of Texas. The National Weather Service reported 5.5 inches (14 cm) in Baytown, a city located east of Houston on the northern shore of Galveston Bay. Other cities and locales received upwards of 3 to 4 inches (7.6 to 10.2 cm).
LCMAP land cover and Landsat imagery from 1985 to 2021 of the Wragg Fire area in California
LCMAP land cover and Landsat imagery from 1985 to 2021 of the Wragg Fire area in CaliforniaThese animations are from the Wragg Fire that occurred north of San Francisco, California, in 2015. On the left is Land Change Monitoring, Assessment and Projection, or LCMAP (v1.3), land cover, with green representing forests (tree cover). On the right is false-color Landsat satellite imagery.
This map of California displays the LCMAP (Land Change Monitoring, Assessment and Projection) Primary Land Cover for California in 1985. The green represents forests (tree cover). Learn more in a study. USGS EROS map
This map of California displays the LCMAP (Land Change Monitoring, Assessment and Projection) Primary Land Cover for California in 2021. The green represents forests (tree cover). Learn more in the study. USGS EROS map
LCMAP land cover and Landsat imagery from 1985 to 2021 in California's Butte and Plumas counties
LCMAP land cover and Landsat imagery from 1985 to 2021 in California's Butte and Plumas countiesThese animations are from Butte and Plumas counties in northeastern California from 1985 to 2021. On the left is Land Change Monitoring, Assessment and Projection, or LCMAP (v1.3), land cover, with green representing forests (tree cover). On the right is true-color Landsat satellite imagery.
The USGS provides research-quality, applications-ready Landsat Level-2 and Level-3 science products to support an array of land surface change studies. Collection 2 Level-2 scene-based science products include Surface Reflectance, Surface Temperature, Surface Reflectance-Derived Spectral Indices, and Provisional Aquatic Reflectance.
Landsat 8 Image of the Salt Dome Islands of Louisiana
Landsat 8 Image of the Salt Dome Islands of LouisianaLouisiana is home to numerous salt domes, including the five distinct coastal salt dome islands that can be found in the southern part of the state near the Gulf of America. Formed by the upward pressure of ancient salt deposits, these hills rise above the surrounding marshes and coastal plains of Louisiana.
This is the cover page of the Annual National Land Cover Database (NLCD) fact sheet, produced at the USGS Earth Resources Observation and Science (EROS) Center. Find the full fact sheet here.
Debut of the Annual National Land Cover Database (NLCD)
Debut of the Annual National Land Cover Database (NLCD)Poster introducing the 2023 Annual National Land Cover Database (NLCD). "Development and Cloud Implementation of the New Annual NLCD for the United States." Created by USGS Earth Resources Observation and Science (EROS) Center. Find full PDF here.
Landsat 9 Image of the Greater Los Angeles Fires - January 14, 2025 (During)
Landsat 9 Image of the Greater Los Angeles Fires - January 14, 2025 (During)The tragic fires sweeping across the Greater Los Angeles area in January 2025 have burned more than 40,000 acres, destroyed more than 12,300 structures, and prompted evacuation orders and warnings for as many as 200,000 residents. Exceptionally dry conditions, coupled with strong Santa Ana winds, have fueled the fires.
Landsat 9 Sees Diverse Landscapes of the Desert Southwest
Landsat 9 Sees Diverse Landscapes of the Desert SouthwestThe USGS EROS Landsat archive recently reached a milestone of 12 million Landsat Collection 2 Level-1 products. These are available for download at no charge. The image representing this milestone displays a sprawling desert landscape and contains a multitude of agricultural, geological, and urban features.
Landsat 8 Image of the Greater Los Angeles Fires - January 6, 2025 (Before)
Landsat 8 Image of the Greater Los Angeles Fires - January 6, 2025 (Before)The tragic fires sweeping across the Greater Los Angeles area have burned more than 40,000 acres, destroyed more than 12,300 structures, and prompted evacuation orders and warnings for as many as 200,000 residents. Exceptionally dry conditions, coupled with strong Santa Ana winds, have fueled the fires.
The USGS Landsat archive holds over fifty years of Earth-Observing satellite data. This animation displays the cumulative number of Landsat scenes since 1972. The colors on the maps show the density of the number of Landsat Level-1 products.
Landsat 8 and Landsat 9 kicked off 2025 by acquiring over 1,400 scenes on the first of January. This Landsat 9 image of Emi Koussi in the Tibesti Range of Chad is a mosaic of two of the many scenes collected. Emi Koussi is an extinct shield volcano that rises to 11,204 feet (3,415 meters) above sea level, making it the highest summit in Chad and the Sahara Desert.
Shrub Distribution Over the McDermitt Caldera Region
Shrub Distribution Over the McDermitt Caldera RegionThis map shows 2024 shrub cover from the Rangeland Condition Monitoring Assessment and Projection (RCMAP) project across the McDermitt Caldera, outlined in gray, along the Nevada–Oregon border. Dark green areas indicate high shrub cover, typically found in riparian zones and at higher elevations.
Burn Severity Map of the August Complex wildfire, created by the USGS Burned Area Emergency Response (BAER) program. The August Complex, which burned over 1 million acres in California in 2020, is the largest wildfire in state history.
The Wind River Range, located in west-central Wyoming, is a unique wilderness area that rises from the high plains of the South Pass of the Continental Divide and runs northwest to the Yellowstone Plateau. The Winds, as they are affectionately known, are exceptionally long, wide, high, rugged, and remote.
A seamless 1-meter Digital Elevation Model (DEM) for the Lower Androscoggin watershed in Maine, produced by scientists at the USGS National Geospatial Technical Operations Center (NGTOC) and USGS Earth Resources Observation and Science (EROS) Center. Elevations run from low elevation in light blue on up to tan, green, yellow, red and finally gray/white.