
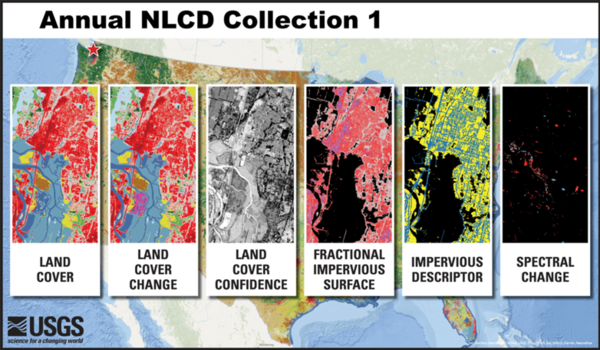
The six different Annual NLCD science products are Land Cover, Land Cover Change, Land Cover Confidence Index, Fractional Impervious Surface, Impervious Descriptor, and Spectral Change Day of Year. Annual NLCD Collection 1 is available beginning with data from 1985. The Land Cover classes are based on a modified Anderson Level II classification system.
Images
Peruse our selection of remote sensing and Earth science imagery below.
Filter Total Items: 871
Annual NLCD Collection 1 Products
The six different Annual NLCD science products are Land Cover, Land Cover Change, Land Cover Confidence Index, Fractional Impervious Surface, Impervious Descriptor, and Spectral Change Day of Year. Annual NLCD Collection 1 is available beginning with data from 1985. The Land Cover classes are based on a modified Anderson Level II classification system.
Annual NLCD animation of the Smith River Complex Fire land change between 2023 and 2024
Annual NLCD animation of the Smith River Complex Fire land change between 2023 and 2024This Annual National Land Cover Database (NLCD) animation shows how the Smith River Complex Fire, which occurred in the fall of 2023 at the California-Oregon border, left a devastating mark on the landscape.

Annual National Land Cover Database (NLCD) land cover map for 2024
Annual National Land Cover Database (NLCD) land cover map for 2024Annual National Land Cover Database (NLCD) land cover map for 2024. Annual NLCD has a 40-year historic record of land cover and land change, from 1985-2024. Annual NLCD, based on Landsat data, is produced at the USGS Earth Resources Observation and Science (EROS) Center.

NLCD Product Suite Table
A table comparing the Annual NLCD Collection 1.0 to Collection 1.1 for Landsat ARD Source, Product Date Range, and Release Date.
A table comparing the Annual NLCD Collection 1.0 to Collection 1.1 for Landsat ARD Source, Product Date Range, and Release Date.

Landsat 7 Mission - by the Numbers
The Landsat 7 satellite was launched on April 15, 1999. The mission was decommissioned on June 4, 2025. The data collected by the satellite's sensor from 1999 to 2024 is a key part of Landsat’s 50-plus year record of imaging our planet’s surface and are preserved in the USGS Earth Resources Observation and Science (EROS) Center archive.
The Landsat 7 satellite was launched on April 15, 1999. The mission was decommissioned on June 4, 2025. The data collected by the satellite's sensor from 1999 to 2024 is a key part of Landsat’s 50-plus year record of imaging our planet’s surface and are preserved in the USGS Earth Resources Observation and Science (EROS) Center archive.
Animation of Landsat images showing fires burning in Saskatchewan, Canada
Animation of Landsat images showing fires burning in Saskatchewan, CanadaIn late May 2025, Landsat satellites captured imagery of active fires in north-central Saskatchewan, Canada. The fires have caused evacuation orders and closed highways. While the natural color image shows the massive smoke covering the land, false color images allow us to see through the smoke and see the areas of active burning more clearly.

Trees in the Black Hills National Forest
Trees in the Black Hills National Forest, South Dakota. Mountains can be seen in the background.
Trees in the Black Hills National Forest, South Dakota. Mountains can be seen in the background.
Animation of Landsat images of ships in U.S. harbors
Animation of Landsat images of ships in U.S. harborsBy layering over 10 years of cloud-free Landsat 8 and Landsat 9 images, we can see the bright trails of ship traffic in major U.S. ports and harbors. Check out these striking patterns from popular shipping waterways, captured using Landsat’s panchromatic band. Just another example of how Landsat helps us understand the world from above.

The BigMAC Exercise Site
This picture is the site of the Big Multi-Agency Campaign (BigMAC), a comprehensive field exercise aimed at assessing current technologies that might be used for validation of surface products derived from satellite imagery, The exercise was held in Brookings, South Dakota in August 2021.
This picture is the site of the Big Multi-Agency Campaign (BigMAC), a comprehensive field exercise aimed at assessing current technologies that might be used for validation of surface products derived from satellite imagery, The exercise was held in Brookings, South Dakota in August 2021.
Landsat View of Glaciers and Fjords in Northern Greenland
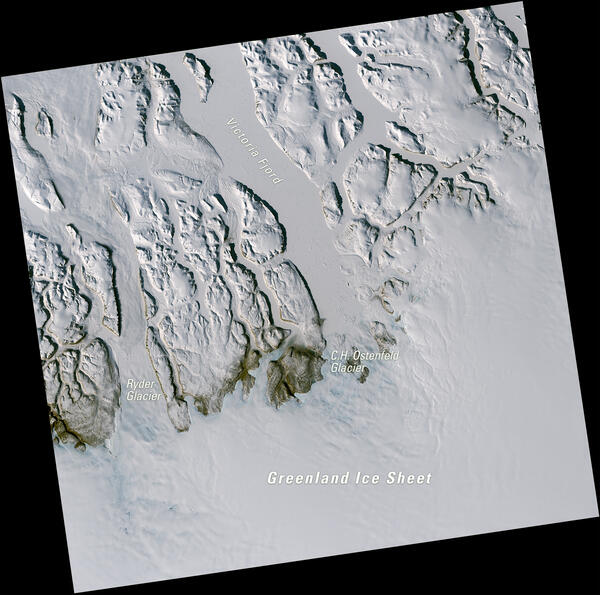
Landsat View of Glaciers and Fjords in Northern GreenlandThis Landsat 8 image of northern Greenland, acquired May 10, 2025, uses the natural color combination of red, green, and blue spectral bands (bands 4,3,2). Snow and ice appear bright white and exposed rock appears brown. The scene features the Ryder Glacier, C.H. Ostenfeld Glacier, and Victoria Fjord, along with part of the Greenland Ice Sheet.
Landsat View of Glaciers and Fjords in Northern Greenland
Landsat View of Glaciers and Fjords in Northern GreenlandThis Landsat 8 image of northern Greenland, acquired May 10, 2025, uses the natural color combination of red, green, and blue spectral bands (bands 4,3,2). Snow and ice appear bright white and exposed rock appears brown. The scene features the Ryder Glacier, C.H. Ostenfeld Glacier, and Victoria Fjord, along with part of the Greenland Ice Sheet.
Landsat View of Namibia’s Fish River Canyon and ǀAi-ǀAis / Richtersveld Transfrontier Park
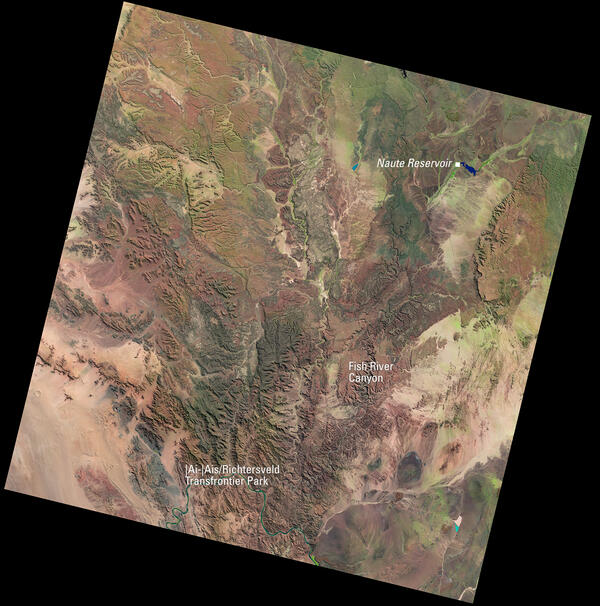
Landsat View of Namibia’s Fish River Canyon and ǀAi-ǀAis / Richtersveld Transfrontier ParkThis Landsat 8 image of southern Namibia, acquired May 7, 2025, uses the shortwave infrared, near infrared, and red spectral bands (bands 6,5,4) to highlight land cover. In this combination, healthy vegetation appears bright green, while bare ground and desert landscapes show in shades of brown and tan.
Landsat View of Namibia’s Fish River Canyon and ǀAi-ǀAis / Richtersveld Transfrontier Park
Landsat View of Namibia’s Fish River Canyon and ǀAi-ǀAis / Richtersveld Transfrontier ParkThis Landsat 8 image of southern Namibia, acquired May 7, 2025, uses the shortwave infrared, near infrared, and red spectral bands (bands 6,5,4) to highlight land cover. In this combination, healthy vegetation appears bright green, while bare ground and desert landscapes show in shades of brown and tan.

Landsat's View of the USA image
How does your state use Landsat satellite data? Visit the Landsat’s View of the USA webpage to find how Landsat benefits each of United States. You can download a satellite image, put together an online puzzle, or read a USGS Fact Sheet for your selected state!
How does your state use Landsat satellite data? Visit the Landsat’s View of the USA webpage to find how Landsat benefits each of United States. You can download a satellite image, put together an online puzzle, or read a USGS Fact Sheet for your selected state!

Landsat image displays recent flooding in the Lake Eyre Basin
Landsat image displays recent flooding in the Lake Eyre BasinIn April 2025, significant flooding occurred in an area of the Lake Eyre Basin in Southern Australia and Queensland states in Australia.
The Landsat 8 and Landsat 9 satellites both passed over the area and captured the dramatic imagery used in this mosaic of the area.

Flooding at the Cullyamurra Waterhole April 2025
In April 2025, the Cullyamurra Waterhole, along the Cooper River in South Australia, reached a water level of 13.39 meters. This surpassed the 1974 record of 11.85 meters.
In April 2025, the Cullyamurra Waterhole, along the Cooper River in South Australia, reached a water level of 13.39 meters. This surpassed the 1974 record of 11.85 meters.

EarthNow! Viewer
The EarthNow! Landsat Image Viewer displays imagery in near real-time as Landsat satellites orbit the Earth. Along with the near real-time video stream, EarthNow! also replays acquisition recordings from previous Landsat overpasses. When Landsat satellites are out of viewing range of a ground station, the most recent overpass is displayed.
The EarthNow! Landsat Image Viewer displays imagery in near real-time as Landsat satellites orbit the Earth. Along with the near real-time video stream, EarthNow! also replays acquisition recordings from previous Landsat overpasses. When Landsat satellites are out of viewing range of a ground station, the most recent overpass is displayed.

March 2025 Before Flooding in the US
This Landsat 8 image shows an area of the east central portion of the United States on March 22, 2025. The muted hues of tan pocked with some green areas indicate vegetation awakening from winter dormancy, and the reservoirs and waterways are well within their banks.
This Landsat 8 image shows an area of the east central portion of the United States on March 22, 2025. The muted hues of tan pocked with some green areas indicate vegetation awakening from winter dormancy, and the reservoirs and waterways are well within their banks.

April 2025 Flooding in the US
Powerful storms containing heavy rains caused major flooding to areas in the east central portion of the United States in early April 2025. Some communities in Kentucky saw more than 15 inches of rain, according to the National Weather Service.
Powerful storms containing heavy rains caused major flooding to areas in the east central portion of the United States in early April 2025. Some communities in Kentucky saw more than 15 inches of rain, according to the National Weather Service.
Landsat View of the Strait of Belle Isle, Canada
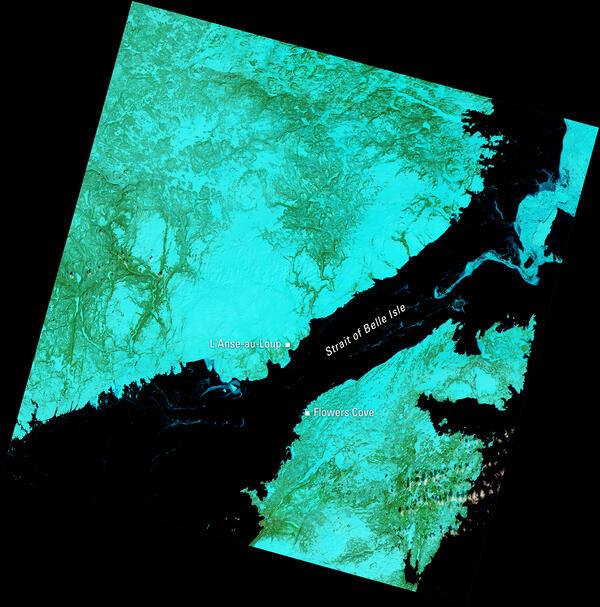
This Landsat 9 image of the Strait of Belle Isle, acquired April 8, 2025, uses the shortwave infrared, near infrared, and red spectral bands (bands 6,5,4) to highlight land cover. In this combination, healthy vegetation appears bright green, snow and ice appear in shades of cyan and blue, and water appears dark.
This Landsat 9 image of the Strait of Belle Isle, acquired April 8, 2025, uses the shortwave infrared, near infrared, and red spectral bands (bands 6,5,4) to highlight land cover. In this combination, healthy vegetation appears bright green, snow and ice appear in shades of cyan and blue, and water appears dark.
Landsat View of Central Germany and the Harz Mountains
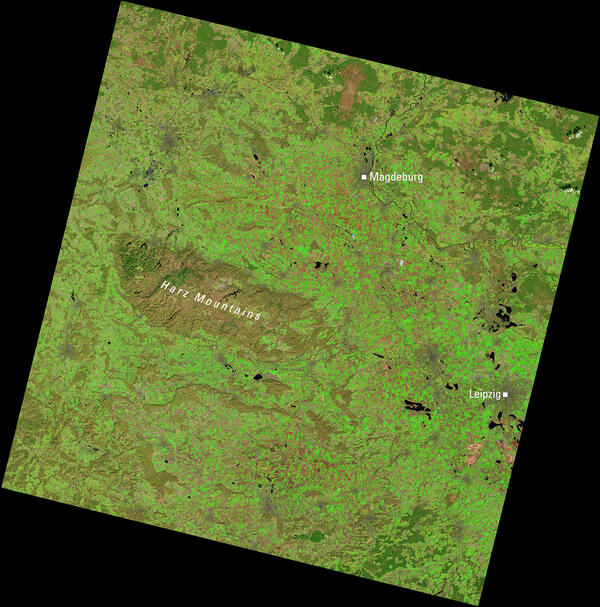
Landsat View of Central Germany and the Harz MountainsThis Landsat 9 image highlights central Germany, including the Harz Mountains to the west and the cities of Magdeburg and Leipzig. The scene uses a shortwave infrared, near-infrared, and red band combination (Bands 6, 5, 4), which enhances vegetation in bright green and helps distinguish urban areas and water features.
Landsat View of Central Germany and the Harz Mountains
Landsat View of Central Germany and the Harz MountainsThis Landsat 9 image highlights central Germany, including the Harz Mountains to the west and the cities of Magdeburg and Leipzig. The scene uses a shortwave infrared, near-infrared, and red band combination (Bands 6, 5, 4), which enhances vegetation in bright green and helps distinguish urban areas and water features.
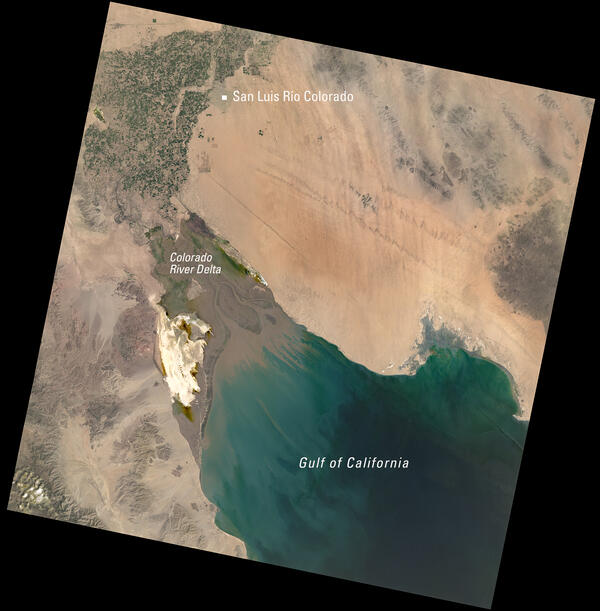
Landsat View of the Colorado River Delta and Gulf of California
Landsat View of the Colorado River Delta and Gulf of CaliforniaThis Landsat 9 image of northwestern Mexico, acquired March 30, 2025, uses the natural color combination of red, green, and blue spectral bands (bands 4,3,2). The scene highlights the Colorado River Delta, where desert meets irrigated farmland near San Luis Río Colorado, before flowing into the blue-green waters of the Gulf of California.

Tongariro National Park’s Volcanic Massif
This Landsat 8 image displays the massif of the three active volcanoes that dominate Tongariro National Park, on New Zealand’s North Island.
This Landsat 8 image displays the massif of the three active volcanoes that dominate Tongariro National Park, on New Zealand’s North Island.