
John Barron is standing in front of some trees with green foliage. He has grey hair and is wearing a purple and blue plaid printed button down, collared shirt and smiling at the camera.
Images
Geology, Minerals, Energy, and Geophysics multi-media
Filter Total Items: 81
John Barron Profile picture
John Barron is standing in front of some trees with green foliage. He has grey hair and is wearing a purple and blue plaid printed button down, collared shirt and smiling at the camera.
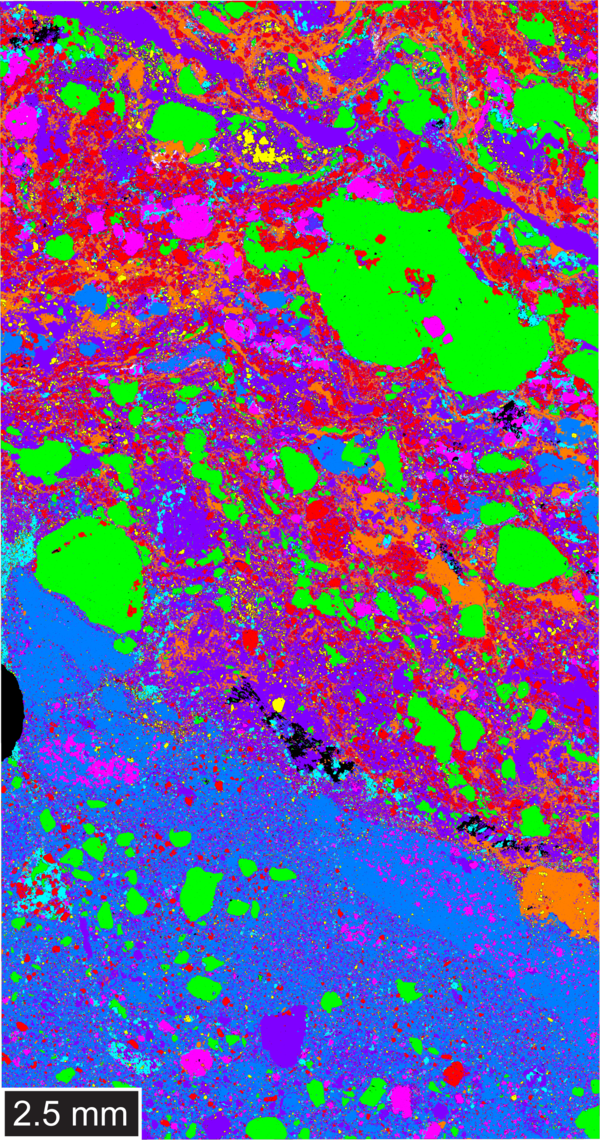
False color phase map of host breccia from Hicks Dome, Illinois
False color phase map of host breccia from Hicks Dome, IllinoisFalse color phase map of host breccia sample from Hicks Dome, Illinois. Image includes the phases of: pyrite, fluorite, quartz, barite-celestite, brookite-anatase, fluorapatite, illite, and dolomite-calcite with Mg-enrichment.
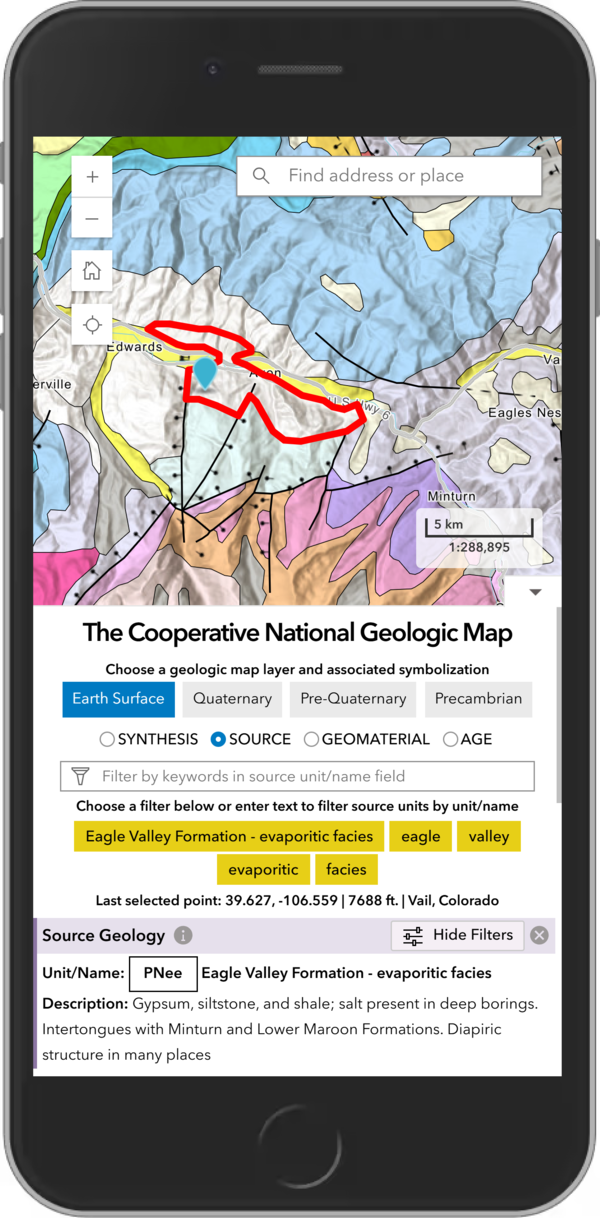
The USGS Cooperative National Geologic Map on smartphone
The USGS Cooperative National Geologic Map on smartphoneThe new USGS Cooperative National Geologic Map web tool was designed to also be mobile friendly, allowing users to explore geologic data from smartphones and tablets, in addition to larger devices. USGS image.
Hydrothermal Energy Resources (Illustrated GIF)
Conventional hydrothermal resources occur below the ground where three ingredients combine: heat, water and permeable rock. When heated water or steam is trapped in a porous rock below a layer of less permeable rock, a hydrothermal reservoir is formed.
Conventional hydrothermal resources occur below the ground where three ingredients combine: heat, water and permeable rock. When heated water or steam is trapped in a porous rock below a layer of less permeable rock, a hydrothermal reservoir is formed.
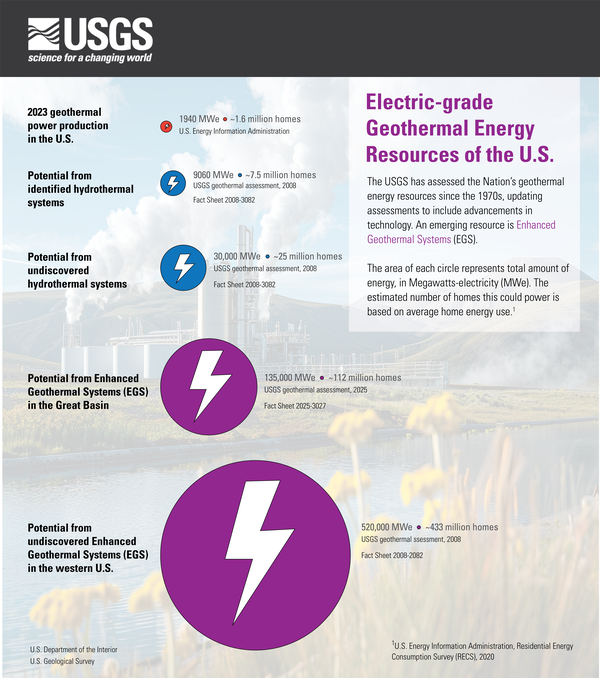
Electric-grade geothermal energy resources of the U.S.
Electric-grade geothermal energy resources of the U.S.Infographic of Electric-grade geothermal energy resources of the U.S.
The USGS has assessed the Nation’s geothermal energy resources since the 1970s, updating assessments to include advancements in technology. An emerging resource is Enhanced Geothermal Systems (EGS).
Enhanced Geothermal Systems (Illustrated GIF)
Enhanced Geothermal Systems are an emerging resource that the USGS studies. To generate electricity from these systems, fractures are engineered into deep, low-porosity hot rocks to allow water to circulate. Then, the heated water is pumped back to the surface, where the thermal energy is used to move a turbine and generate electricity.
Enhanced Geothermal Systems are an emerging resource that the USGS studies. To generate electricity from these systems, fractures are engineered into deep, low-porosity hot rocks to allow water to circulate. Then, the heated water is pumped back to the surface, where the thermal energy is used to move a turbine and generate electricity.

Multidisciplinary approach to prioritize critical elements for environmental research.
Multidisciplinary approach to prioritize critical elements for environmental research.This infographic introduces an approach that could subsequently be used to prioritize environmental research for the full range of critical elements.
By
Ecosystems Mission Area, Energy and Mineral Resources Mission Area, Contaminant Biology, Environmental Health Program, Toxic Substances Hydrology, Geology, Energy & Minerals Science Center, Geology, Geophysics, and Geochemistry Science Center, Geology, Minerals, Energy, and Geophysics Science Center

Geomorphic map of Echo, Oregon
This geomorphic map of Echo, Oregon shows the town is built on valley bottom terrain. Other landforms such as slopes, fans, bedrock, etc. are delineated in the surrounding area. From https://www.usgs.gov/maps/geomorphic-map-umatilla-river-corridor-oregon.
This geomorphic map of Echo, Oregon shows the town is built on valley bottom terrain. Other landforms such as slopes, fans, bedrock, etc. are delineated in the surrounding area. From https://www.usgs.gov/maps/geomorphic-map-umatilla-river-corridor-oregon.
Geologists examining sedimentary rocks
USGS geologists Laura Walkup and Jim O'Connor examine the Glenns Ferry Formation, a sedimentary unit deposited in the western Snake River Plain
USGS geologists Laura Walkup and Jim O'Connor examine the Glenns Ferry Formation, a sedimentary unit deposited in the western Snake River Plain
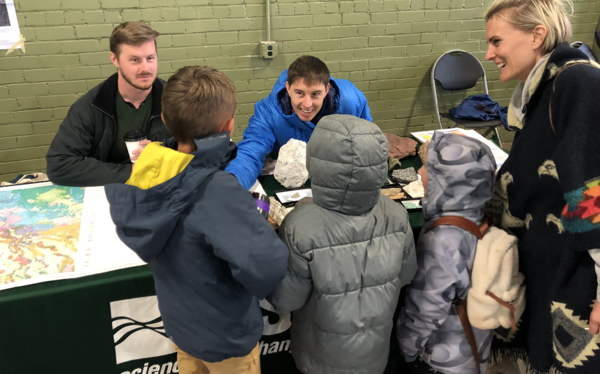
Geology, Minerals, Energy, Geophysics Science Center (GMEG) staff display geologic rocks and maps and talk to kids about geology at the 2024 STEM event
Geology, Minerals, Energy, Geophysics Science Center (GMEG) staff display geologic rocks and maps and talk to kids about geology at the 2024 STEM eventUSGS Geology, Minerals, Energy, Geophysics Science Center (GMEG) staff display rocks and maps and talk to kids about geology at the 2024 STEM event.
Geology, Minerals, Energy, Geophysics Science Center (GMEG) staff display geologic rocks and maps and talk to kids about geology at the 2024 STEM event
Geology, Minerals, Energy, Geophysics Science Center (GMEG) staff display geologic rocks and maps and talk to kids about geology at the 2024 STEM eventGeology, Minerals, Energy, Geophysics Science Center (GMEG) staff display geologic rocks and maps and talk to kids about geology at the 2024 STEM event
Geology, Minerals, Energy, Geophysics Science Center (GMEG) staff display geologic rocks and maps and talk to kids about geology at the 2024 STEM eventUSGS Geology, Minerals, Energy, Geophysics Science Center (GMEG) staff display rocks and maps and talk to kids about geology at the 2024 STEM event.
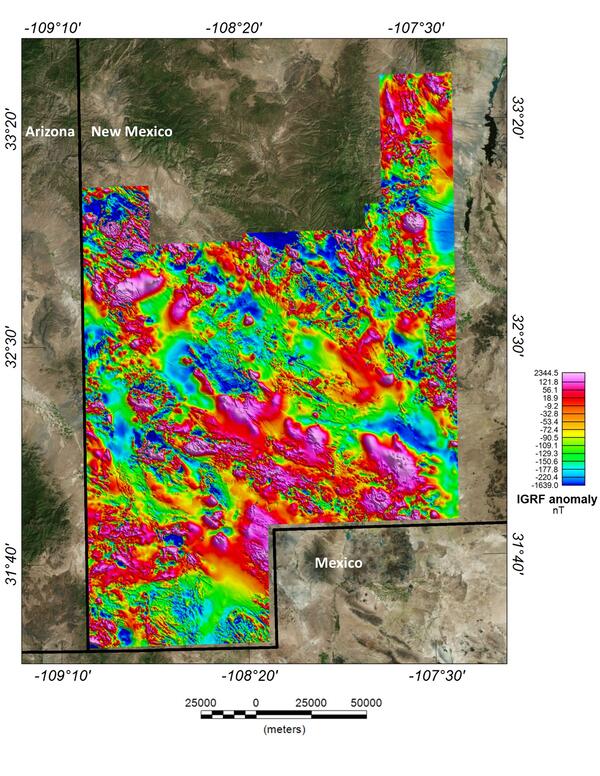
New Mexico porphyry copper belt aeromagnetic survey magnetic anomaly data
New Mexico porphyry copper belt aeromagnetic survey magnetic anomaly dataThis image depicts the magnetic anomaly map of the region covered by the Southwest New Mexico aeromagnetic/aeroradiometric survey. These data allow us to model the subsurface structure and composition of the upper crust.

Saucer Shark Aeroshell and payload suspended by sling
Saucer Shark Aeroshell and payload suspended by slingUSGS National Innovation Center UAS Research Center Saucer Shark Project, before science flight tests, Aeroshell and payload. Sling configuration and payload orientation verified before science flight deployment. Payload is on and ready to record!

BisonCore (MagEdition) displays live magnetic data (top) and lidar altitude (bottom)
BisonCore (MagEdition) displays live magnetic data (top) and lidar altitude (bottom)USGS National Innovation Center UAS Research Center Saucer Shark Project, BisonCore displays the path of the sensor live, as it covers transects. Data received from the payload is then displayed within the BisonCore Ecosystem and is accessible for field viewing. The magnetic map is also used to validate payload directed algorithms.
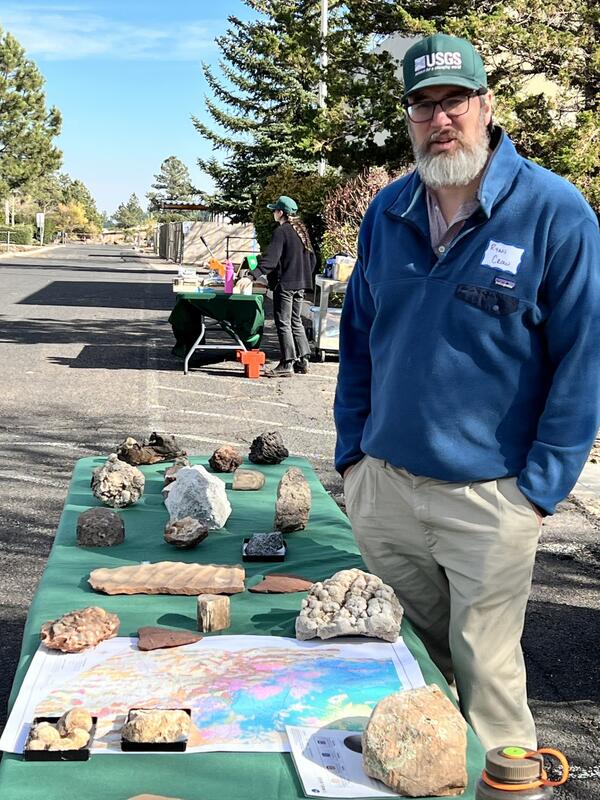
Ryan Crow of the Geology, Minerals, Energy, Geophysics (GMEG) Science Center discusses geology during the USGS Flagstaff Open House, 2023
Ryan Crow of the Geology, Minerals, Energy, Geophysics (GMEG) Science Center discusses geology during the USGS Flagstaff Open House, 2023Ryan Crow of the Geology, Minerals, Energy, Geophysics (GMEG) Science Center discusses geology and displays rock samples during the USGS Flagstaff Open House, 2023. Photo courtesy of Meredith Hartwell, USGS, SBSC.

Saucer Shark Drop Release during testing campaign
USGS National Innovation Center UAS Research Center Saucer Shark Project, during flight tests, drop release attached to USGS UAV. Aircraft sits on landing pad in-between test flights.
USGS National Innovation Center UAS Research Center Saucer Shark Project, during flight tests, drop release attached to USGS UAV. Aircraft sits on landing pad in-between test flights.

Saucer Shark Deployed Below UAV
USGS National Innovation Center UAS Research Center (UASRC) Saucer Shark Project, during flight tests, fully assembled. Sub assemblies from top down: Drop Release, Sling and Sling Brace, Payload Aeroshell and Payload.
USGS National Innovation Center UAS Research Center (UASRC) Saucer Shark Project, during flight tests, fully assembled. Sub assemblies from top down: Drop Release, Sling and Sling Brace, Payload Aeroshell and Payload.
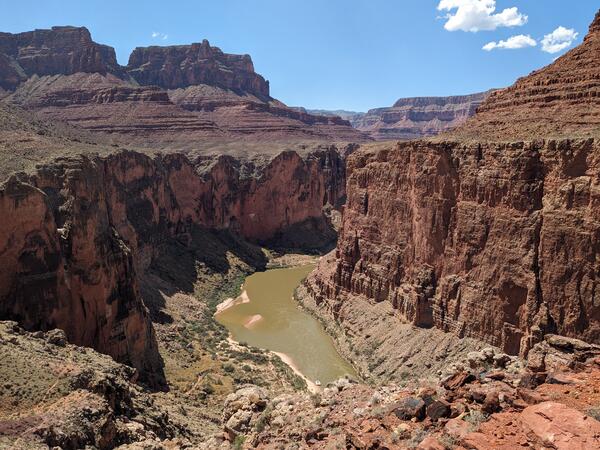
Grand_Canyon_20230908_Brennan.jpg
Photograph of the Colorado River in the Grand Canyon, Arizona, USA. Photo taken on September 8, 2023.
By
Core Science Systems Mission Area, Natural Hazards Mission Area, Water Resources Mission Area, Mineral Resources Program, National Cooperative Geologic Mapping Program, National Water Quality Program, Toxic Substances Hydrology, Geology, Geophysics, and Geochemistry Science Center, Geology, Minerals, Energy, and Geophysics Science Center, Geosciences and Environmental Change Science Center, New Mexico Water Science Center, Southwest Biological Science Center, Denver Radiogenic Isotope Lab, National Water Quality Laboratory, New Mexico Water Science Center Sediment Laboratory, Organic Geochemistry Laboratory, Geological Materials Repository, Geology and Ecology of National Parks, Colorado River Basin: Actionable and Strategic Integrated Science and Technology

PXL_20230912_163459658~5_Kelsey Brennan.jpg
Kelsey Brennan is smiling at the camera. She is wearing a pink ball cap, sunglasses on the bill, a green and white polka dotted kerchief, wearing a light blue, long sleeved shirt with a grey-blue backpack standing on a wood plank bridge, with rock walls in the background.
Kelsey Brennan is smiling at the camera. She is wearing a pink ball cap, sunglasses on the bill, a green and white polka dotted kerchief, wearing a light blue, long sleeved shirt with a grey-blue backpack standing on a wood plank bridge, with rock walls in the background.
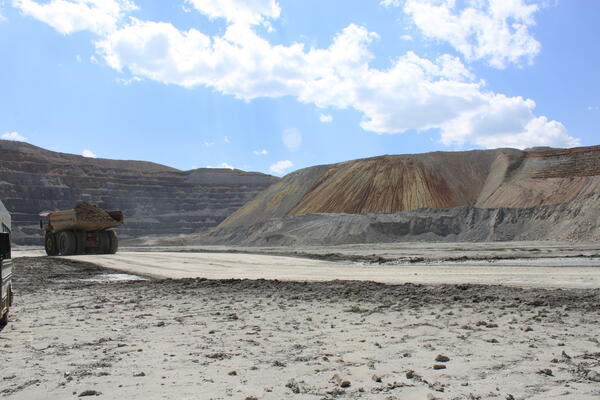
Mine Waste, Butte Deposit, Montana
View from the floor of the Continental Mine (Continental Pit) facing an in-pit material dump to the west, Butte, Montana.
View from the floor of the Continental Mine (Continental Pit) facing an in-pit material dump to the west, Butte, Montana.
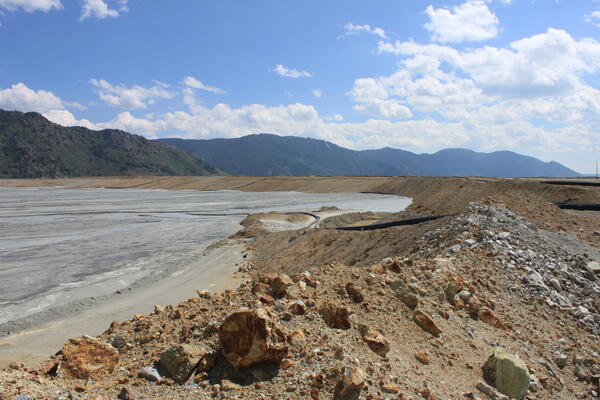
Mine Tailings Near Butte, MT
Edge of the Yankee Doodle Tailings Pond in Butte, Montana, where the tailings slurry is piped into the pond.
Edge of the Yankee Doodle Tailings Pond in Butte, Montana, where the tailings slurry is piped into the pond.

Mountain Pass carbonatite thin section maps
Thin section of a Mountain Pass carbonatite sample showing mineralogy and texture with slider for back-scattered electron map (black and white) and layered elemental map (colored). Note the large, euhedral, tabular crystal of bastnäsite.
Thin section of a Mountain Pass carbonatite sample showing mineralogy and texture with slider for back-scattered electron map (black and white) and layered elemental map (colored). Note the large, euhedral, tabular crystal of bastnäsite.