



The Chesapeake Bay is the largest estuary in the United States. Located in the Mid-Atlantic region of the East Coast, it runs north-south from the mouth of the Susquehanna River near Havre de Grace, Maryland, to the Atlantic Ocean near Virginia Beach, Virginia.
Images
Explore the images on this page to learn more about the Landsat sensors, satellites and missions.
Filter Total Items: 415

Landsat Mosaic of the Chesapeake Bay
The Chesapeake Bay is the largest estuary in the United States. Located in the Mid-Atlantic region of the East Coast, it runs north-south from the mouth of the Susquehanna River near Havre de Grace, Maryland, to the Atlantic Ocean near Virginia Beach, Virginia.

Annual NLCD for the Chesapeake Bay Region
The Chesapeake Bay watershed has experienced substantial population growth over the last several decades. Since 1950, the population has more than doubled, and between 1980 and 2023, the number increased from 12.7 million to 18.6 million.
The Chesapeake Bay watershed has experienced substantial population growth over the last several decades. Since 1950, the population has more than doubled, and between 1980 and 2023, the number increased from 12.7 million to 18.6 million.

Greater Los Angeles Fires January 2025
Fires swept across the greater Los Angeles area in early January, scarring more than 50,000 acres and destroying over 15,000 structures. Exceptionally dry conditions, coupled with strong Santa Ana winds, fueled the fires.
Fires swept across the greater Los Angeles area in early January, scarring more than 50,000 acres and destroying over 15,000 structures. Exceptionally dry conditions, coupled with strong Santa Ana winds, fueled the fires.

Landsat Level-2 Provisional Aquatic Reflectance of the Chesapeake Bay
Landsat Level-2 Provisional Aquatic Reflectance of the Chesapeake BayThe Chesapeake Bay watershed spans more than 64,000 square miles (166,000 square kilometers) and encompasses parts of six states—Delaware, Maryland, New York, Pennsylvania, Virginia, and West Virginia—and the District of Columbia.
Landsat Level-2 Provisional Aquatic Reflectance of the Chesapeake Bay
Landsat Level-2 Provisional Aquatic Reflectance of the Chesapeake BayThe Chesapeake Bay watershed spans more than 64,000 square miles (166,000 square kilometers) and encompasses parts of six states—Delaware, Maryland, New York, Pennsylvania, Virginia, and West Virginia—and the District of Columbia.

Landsat Level-3 Dynamic Surface Water Extent of the Chesapeake Bay
Landsat Level-3 Dynamic Surface Water Extent of the Chesapeake BayThe Chesapeake Bay is roughly 200 miles (322 kilometers) in length and varies in width from a mere 4 miles (6.4 kilometers) near Aberdeen, Maryland, to 30 miles (48 kilometers) near Cape Charles, Virginia.
Landsat Level-3 Dynamic Surface Water Extent of the Chesapeake Bay
Landsat Level-3 Dynamic Surface Water Extent of the Chesapeake BayThe Chesapeake Bay is roughly 200 miles (322 kilometers) in length and varies in width from a mere 4 miles (6.4 kilometers) near Aberdeen, Maryland, to 30 miles (48 kilometers) near Cape Charles, Virginia.

Landsat 8 Image of Snowfall in Houston, Texas
On Tuesday, January 21, 2025, Winter Storm Enzo brought an exceptionally rare snowfall to the Greater Houston metro area of Texas. The National Weather Service reported 5.5 inches (14 cm) in Baytown, a city located east of Houston on the northern shore of Galveston Bay. Other cities and locales received upwards of 3 to 4 inches (7.6 to 10.2 cm).
On Tuesday, January 21, 2025, Winter Storm Enzo brought an exceptionally rare snowfall to the Greater Houston metro area of Texas. The National Weather Service reported 5.5 inches (14 cm) in Baytown, a city located east of Houston on the northern shore of Galveston Bay. Other cities and locales received upwards of 3 to 4 inches (7.6 to 10.2 cm).

LCMAP land cover and Landsat imagery from 1985 to 2021 of the Wragg Fire area in California
LCMAP land cover and Landsat imagery from 1985 to 2021 of the Wragg Fire area in CaliforniaThese animations are from the Wragg Fire that occurred north of San Francisco, California, in 2015. On the left is Land Change Monitoring, Assessment and Projection, or LCMAP (v1.3), land cover, with green representing forests (tree cover). On the right is false-color Landsat satellite imagery.
LCMAP land cover and Landsat imagery from 1985 to 2021 of the Wragg Fire area in California
LCMAP land cover and Landsat imagery from 1985 to 2021 of the Wragg Fire area in CaliforniaThese animations are from the Wragg Fire that occurred north of San Francisco, California, in 2015. On the left is Land Change Monitoring, Assessment and Projection, or LCMAP (v1.3), land cover, with green representing forests (tree cover). On the right is false-color Landsat satellite imagery.

Landsat Collection 2 Level-2 Science Products
The USGS provides research-quality, applications-ready Landsat Level-2 and Level-3 science products to support an array of land surface change studies. Collection 2 Level-2 scene-based science products include Surface Reflectance, Surface Temperature, Surface Reflectance-Derived Spectral Indices, and Provisional Aquatic Reflectance.
The USGS provides research-quality, applications-ready Landsat Level-2 and Level-3 science products to support an array of land surface change studies. Collection 2 Level-2 scene-based science products include Surface Reflectance, Surface Temperature, Surface Reflectance-Derived Spectral Indices, and Provisional Aquatic Reflectance.

Landsat 8 Image of the Salt Dome Islands of Louisiana
Landsat 8 Image of the Salt Dome Islands of LouisianaLouisiana is home to numerous salt domes, including the five distinct coastal salt dome islands that can be found in the southern part of the state near the Gulf of America. Formed by the upward pressure of ancient salt deposits, these hills rise above the surrounding marshes and coastal plains of Louisiana.
Landsat 8 Image of the Salt Dome Islands of Louisiana
Landsat 8 Image of the Salt Dome Islands of LouisianaLouisiana is home to numerous salt domes, including the five distinct coastal salt dome islands that can be found in the southern part of the state near the Gulf of America. Formed by the upward pressure of ancient salt deposits, these hills rise above the surrounding marshes and coastal plains of Louisiana.

Landsat 9 Image of the Greater Los Angeles Fires - January 14, 2025 (During)
Landsat 9 Image of the Greater Los Angeles Fires - January 14, 2025 (During)The tragic fires sweeping across the Greater Los Angeles area in January 2025 have burned more than 40,000 acres, destroyed more than 12,300 structures, and prompted evacuation orders and warnings for as many as 200,000 residents. Exceptionally dry conditions, coupled with strong Santa Ana winds, have fueled the fires.
Landsat 9 Image of the Greater Los Angeles Fires - January 14, 2025 (During)
Landsat 9 Image of the Greater Los Angeles Fires - January 14, 2025 (During)The tragic fires sweeping across the Greater Los Angeles area in January 2025 have burned more than 40,000 acres, destroyed more than 12,300 structures, and prompted evacuation orders and warnings for as many as 200,000 residents. Exceptionally dry conditions, coupled with strong Santa Ana winds, have fueled the fires.

Landsat 9 Sees Diverse Landscapes of the Desert Southwest
Landsat 9 Sees Diverse Landscapes of the Desert SouthwestThe USGS EROS Landsat archive recently reached a milestone of 12 million Landsat Collection 2 Level-1 products. These are available for download at no charge. The image representing this milestone displays a sprawling desert landscape and contains a multitude of agricultural, geological, and urban features.
Landsat 9 Sees Diverse Landscapes of the Desert Southwest
Landsat 9 Sees Diverse Landscapes of the Desert SouthwestThe USGS EROS Landsat archive recently reached a milestone of 12 million Landsat Collection 2 Level-1 products. These are available for download at no charge. The image representing this milestone displays a sprawling desert landscape and contains a multitude of agricultural, geological, and urban features.

Landsat 8 Image of the Greater Los Angeles Fires - January 6, 2025 (Before)
Landsat 8 Image of the Greater Los Angeles Fires - January 6, 2025 (Before)The tragic fires sweeping across the Greater Los Angeles area have burned more than 40,000 acres, destroyed more than 12,300 structures, and prompted evacuation orders and warnings for as many as 200,000 residents. Exceptionally dry conditions, coupled with strong Santa Ana winds, have fueled the fires.
Landsat 8 Image of the Greater Los Angeles Fires - January 6, 2025 (Before)
Landsat 8 Image of the Greater Los Angeles Fires - January 6, 2025 (Before)The tragic fires sweeping across the Greater Los Angeles area have burned more than 40,000 acres, destroyed more than 12,300 structures, and prompted evacuation orders and warnings for as many as 200,000 residents. Exceptionally dry conditions, coupled with strong Santa Ana winds, have fueled the fires.

Landsat 9 Image of Emi Koussi in Chad
Landsat 8 and Landsat 9 kicked off 2025 by acquiring over 1,400 scenes on the first of January. This Landsat 9 image of Emi Koussi in the Tibesti Range of Chad is a mosaic of two of the many scenes collected. Emi Koussi is an extinct shield volcano that rises to 11,204 feet (3,415 meters) above sea level, making it the highest summit in Chad and the Sahara Desert.
Landsat 8 and Landsat 9 kicked off 2025 by acquiring over 1,400 scenes on the first of January. This Landsat 9 image of Emi Koussi in the Tibesti Range of Chad is a mosaic of two of the many scenes collected. Emi Koussi is an extinct shield volcano that rises to 11,204 feet (3,415 meters) above sea level, making it the highest summit in Chad and the Sahara Desert.

Landsat 8 image of western NY area after December snowfall
Landsat 8 image of western NY area after December snowfallOn December 12, 2024, heavy lake effect snow blanketed the Buffalo, New York metro area with over 2 feet accumulating in less than 24 hours. This area normally receives heavy snowfall each year during the Northern Hemisphere winter months due to being situated along the shore of Lake Erie.
Landsat 8 image of western NY area after December snowfall
Landsat 8 image of western NY area after December snowfallOn December 12, 2024, heavy lake effect snow blanketed the Buffalo, New York metro area with over 2 feet accumulating in less than 24 hours. This area normally receives heavy snowfall each year during the Northern Hemisphere winter months due to being situated along the shore of Lake Erie.

Landsat Mosaic of the Wind River Range in Wyoming
The Wind River Range, located in west-central Wyoming, is a unique wilderness area that rises from the high plains of the South Pass of the Continental Divide and runs northwest to the Yellowstone Plateau. The Winds, as they are affectionately known, are exceptionally long, wide, high, rugged, and remote.
The Wind River Range, located in west-central Wyoming, is a unique wilderness area that rises from the high plains of the South Pass of the Continental Divide and runs northwest to the Yellowstone Plateau. The Winds, as they are affectionately known, are exceptionally long, wide, high, rugged, and remote.
Landsat 9 image of irrigated cropland in northeast Nebraska 2024
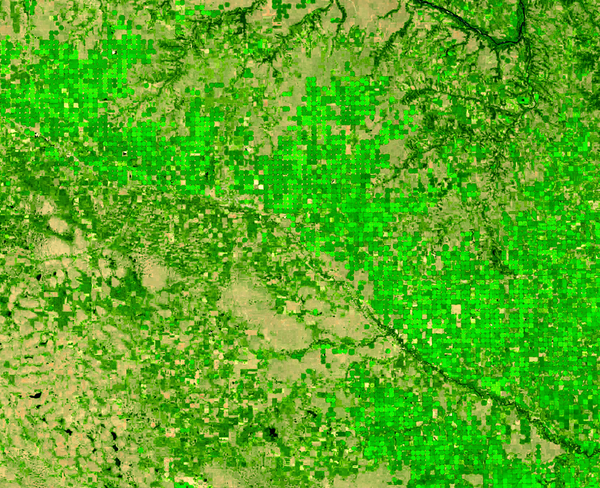
Landsat 9 image of irrigated cropland in northeast Nebraska 2024The green circles in this Landsat 9 image display irrigated cropland in northeast Nebraska during the 2024 growing season. This area is well known for corn and soybeans but also produces potatoes. (Ref: https://croplandcros.scinet.usda.gov/)
Landsat 9 image of irrigated cropland in northeast Nebraska 2024
Landsat 9 image of irrigated cropland in northeast Nebraska 2024The green circles in this Landsat 9 image display irrigated cropland in northeast Nebraska during the 2024 growing season. This area is well known for corn and soybeans but also produces potatoes. (Ref: https://croplandcros.scinet.usda.gov/)

Landsat 9 image of cropland in southeastern Missouri
Landsat 9 image of cropland in southeastern MissouriThis Landsat 9 image displays cropland during the summertime in an area of both Stoddard and New Madrid Counties in southeastern Missouri.
A variety of crops are produced in this area of the country, including corn, soybeans, rice, and cotton.
Landsat 9 image of cropland in southeastern Missouri
Landsat 9 image of cropland in southeastern MissouriThis Landsat 9 image displays cropland during the summertime in an area of both Stoddard and New Madrid Counties in southeastern Missouri.
A variety of crops are produced in this area of the country, including corn, soybeans, rice, and cotton.

Landsat 8 Image of Lake Thompson in South Dakota
Landsat 8 image of Lake Thompson in South Dakota, showing a November algal bloom.
Image date: November 22, 2024
Path 30, Row 29
Band combinations: 654 (false color) to show the algal bloom, and then blended with 432 (natural color) to show the snow.
Landsat 8 image of Lake Thompson in South Dakota, showing a November algal bloom.
Image date: November 22, 2024
Path 30, Row 29
Band combinations: 654 (false color) to show the algal bloom, and then blended with 432 (natural color) to show the snow.

Thumbnail Image for 1 Hour of Earth From Above
Thumbnail image for video: 1 Hour of Earth From Above: Relaxing Landsat Satellite Imagery
Watch here: https://eros.usgs.gov/media-gallery/video-landsat/landsat-1-hour-of-ima…
Thumbnail image for video: 1 Hour of Earth From Above: Relaxing Landsat Satellite Imagery
Watch here: https://eros.usgs.gov/media-gallery/video-landsat/landsat-1-hour-of-ima…

Landsat Satellites Banner Image with Title
Landsat satellites from 1972 to present are shown moving above the Earth. The Van Diemen Gulf along Australia's Northern Territory is visible in a Landsat 8 image acquired on November 18, 2023.
Landsat satellites from 1972 to present are shown moving above the Earth. The Van Diemen Gulf along Australia's Northern Territory is visible in a Landsat 8 image acquired on November 18, 2023.
Landsat Satellites Banner Image
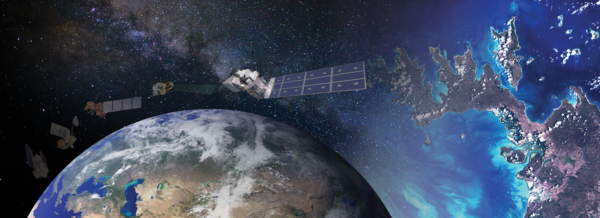
Landsat satellites from 1972 to present are shown moving above the Earth. The Van Diemen Gulf along Australia's Northern Territory is visible in a Landsat 8 image acquired on November 18, 2023.
Landsat satellites from 1972 to present are shown moving above the Earth. The Van Diemen Gulf along Australia's Northern Territory is visible in a Landsat 8 image acquired on November 18, 2023.