
This map displays the scenes acquired by Landsat 4, Landsat 5, and Landsat 7 satellites, on the World Reference System (WRS-2). These scenes were initially downlinked and stored at Landsat International Cooperator Ground Stations.
Images
Explore the images on this page to learn more about the Landsat sensors, satellites and missions.
Filter Total Items: 413
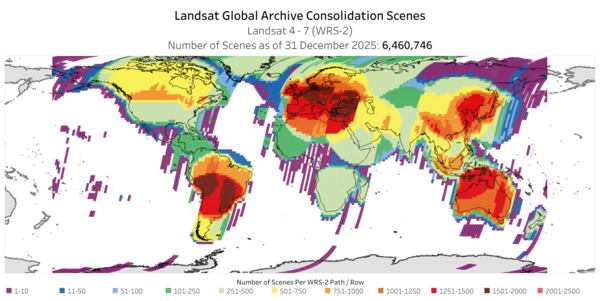
Landsat Global Archive Consolidation WRS 2 Scenes
This map displays the scenes acquired by Landsat 4, Landsat 5, and Landsat 7 satellites, on the World Reference System (WRS-2). These scenes were initially downlinked and stored at Landsat International Cooperator Ground Stations.
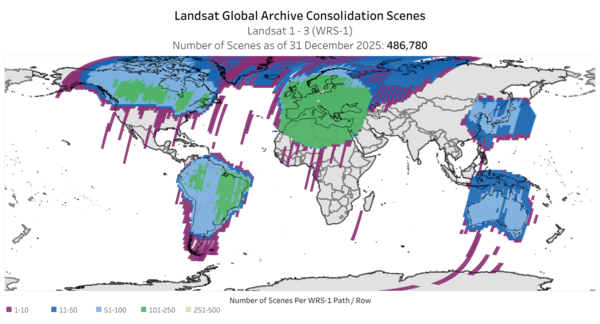
Landsat Global Archive Consolidation WRS 1 Scenes
This map displays the scenes acquired by Landsat 1, Landsat 2, and Landsat 3 satellites, on the World Reference System (WRS-1). These scenes were initially downlinked and stored at Landsat International Cooperator Ground Stations.
This map displays the scenes acquired by Landsat 1, Landsat 2, and Landsat 3 satellites, on the World Reference System (WRS-1). These scenes were initially downlinked and stored at Landsat International Cooperator Ground Stations.
Landsat Benefits Webpage Banner
The Landsat Benefits Webpage Banner displays some ways of how Landsat data benefits the United States.
Visit the Landsat Benefits, State by State webpage to see how Landsat benefits your favorite State!
The Landsat Benefits Webpage Banner displays some ways of how Landsat data benefits the United States.
Visit the Landsat Benefits, State by State webpage to see how Landsat benefits your favorite State!
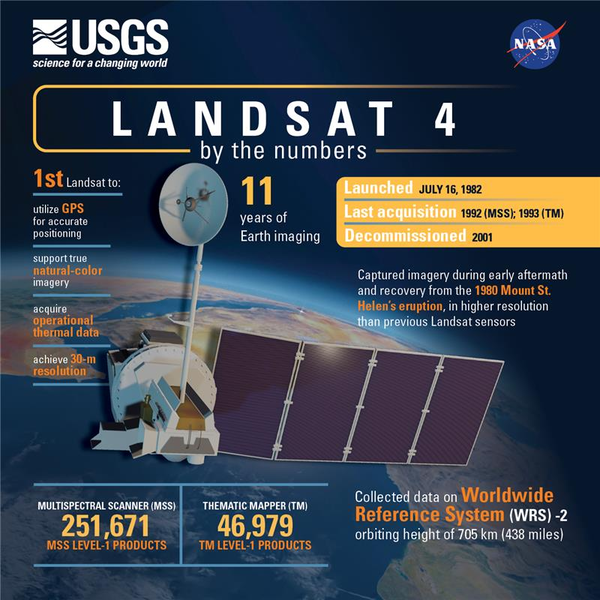
Landsat 4 Mission Infographic
The Landsat 4 satellite was launched July 16, 1982, and ushered in many “firsts” that propelled the Landsat missions that followed.
The Landsat 4 satellite was launched July 16, 1982, and ushered in many “firsts” that propelled the Landsat missions that followed.
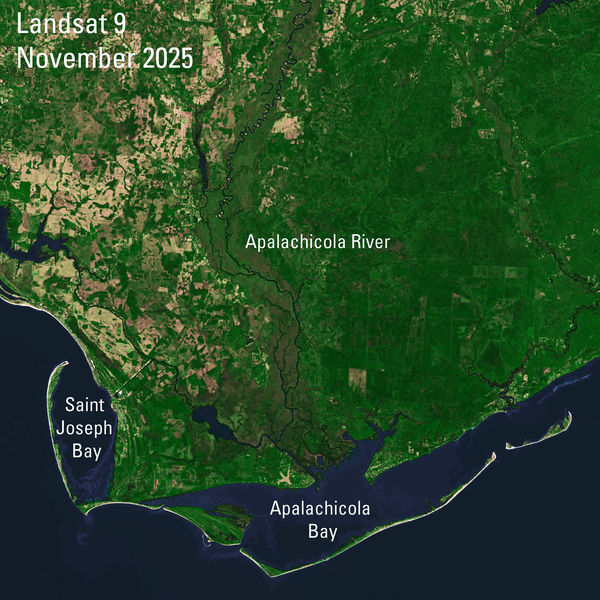
Apalachicola River Watershed and Bay
This Landsat 9 image shows the Apalachicola River and the Apalachicola Bay in Florida’s Panhandle. The river —Florida’s largest in terms of water volume discharge— follows the western boundary of heavy forest and is home to great diversity of freshwater fish species.
This Landsat 9 image shows the Apalachicola River and the Apalachicola Bay in Florida’s Panhandle. The river —Florida’s largest in terms of water volume discharge— follows the western boundary of heavy forest and is home to great diversity of freshwater fish species.
Landsat Sees Where the Snow Lands
November’s final weekend brought snowfall to much of the northern United States. This Landsat 9 image, acquired on December 1st, highlights an area along the South Platte River near the point where the Missouri, Nebraska, and Colorado borders meet.
November’s final weekend brought snowfall to much of the northern United States. This Landsat 9 image, acquired on December 1st, highlights an area along the South Platte River near the point where the Missouri, Nebraska, and Colorado borders meet.
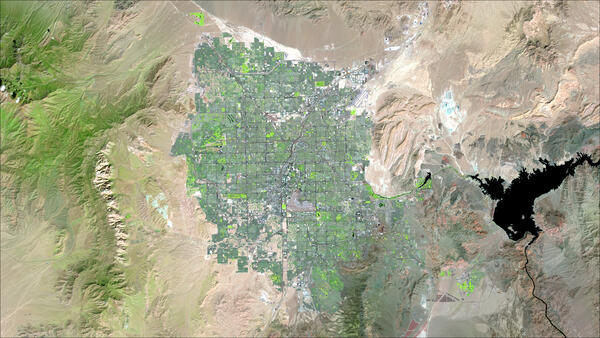
Las Vegas, 2025
This false-color Landsat 8 image, acquired on September 16, 2025, shows the Las Vegas metropolitan area in southern Nevada. Lake Mead is visible east of the city, while the surrounding Mojave Desert, mountain ranges, and irrigated agricultural areas provide contrast with the urban landscape.
This false-color Landsat 8 image, acquired on September 16, 2025, shows the Las Vegas metropolitan area in southern Nevada. Lake Mead is visible east of the city, while the surrounding Mojave Desert, mountain ranges, and irrigated agricultural areas provide contrast with the urban landscape.

Annual NLCD and Landsat animations of the Boise, Idaho, area
Annual NLCD and Landsat animations of the Boise, Idaho, areaThis animation shows Treasure Valley, part of the Snake River Valley and home to the Boise, Idaho, metro area. The Boise Mountains lie to the east, and cropland and pasture/hay land lie to the west. The area’s population has seen significant growth in recent decades, far more than doubling between 1990 and now to above 800,000.
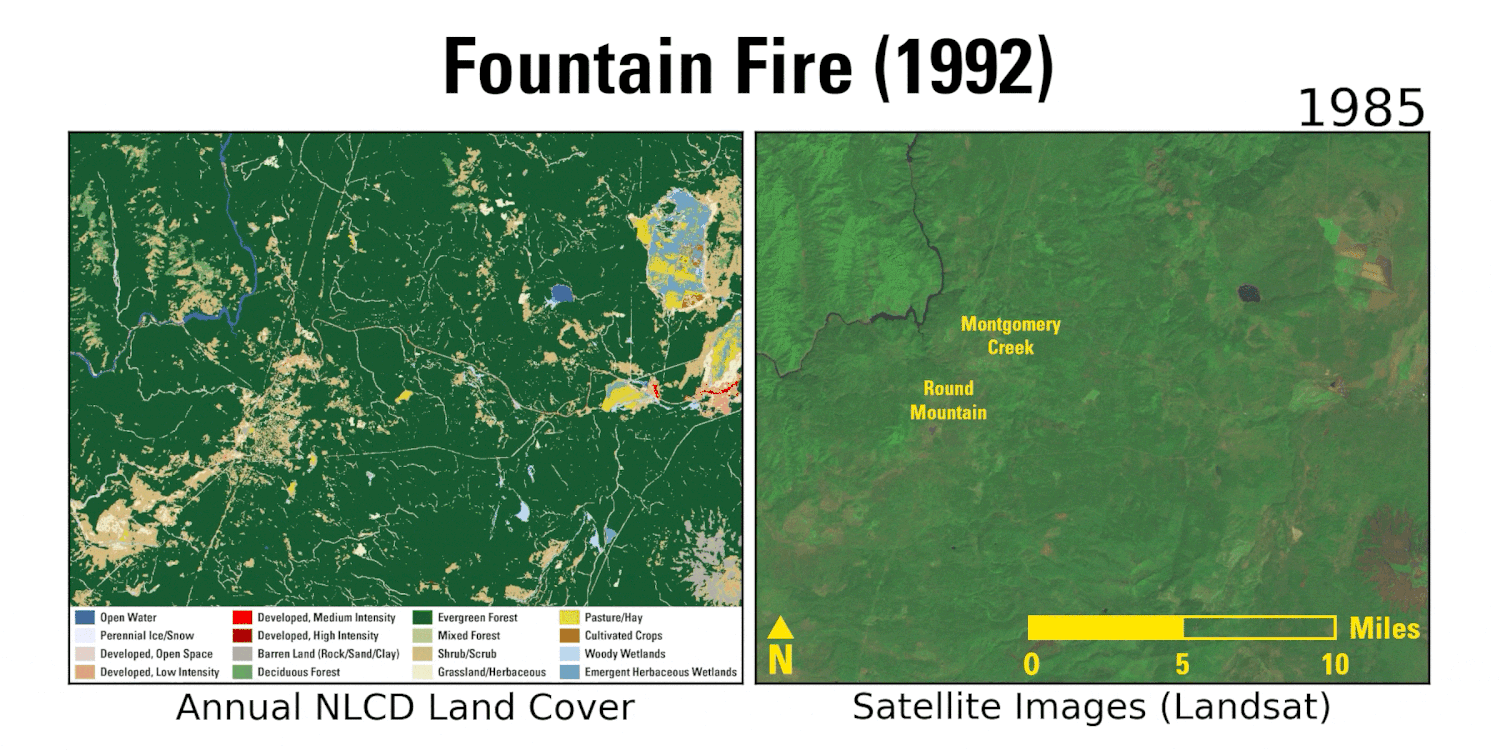
Animations (Annual NLCD and Landsat) of the 1992 Fountain Fire in California
Animations (Annual NLCD and Landsat) of the 1992 Fountain Fire in CaliforniaThis animation shows Annual NLCD land cover data on the left that was derived from Landsat imagery on the right. It illustrates the effects of the 1992 Fountain Fire in northern California and much of the forested area’s eventual recovery. The Fountain Fire burned about 64,000 acres, almost all of it privately owned.
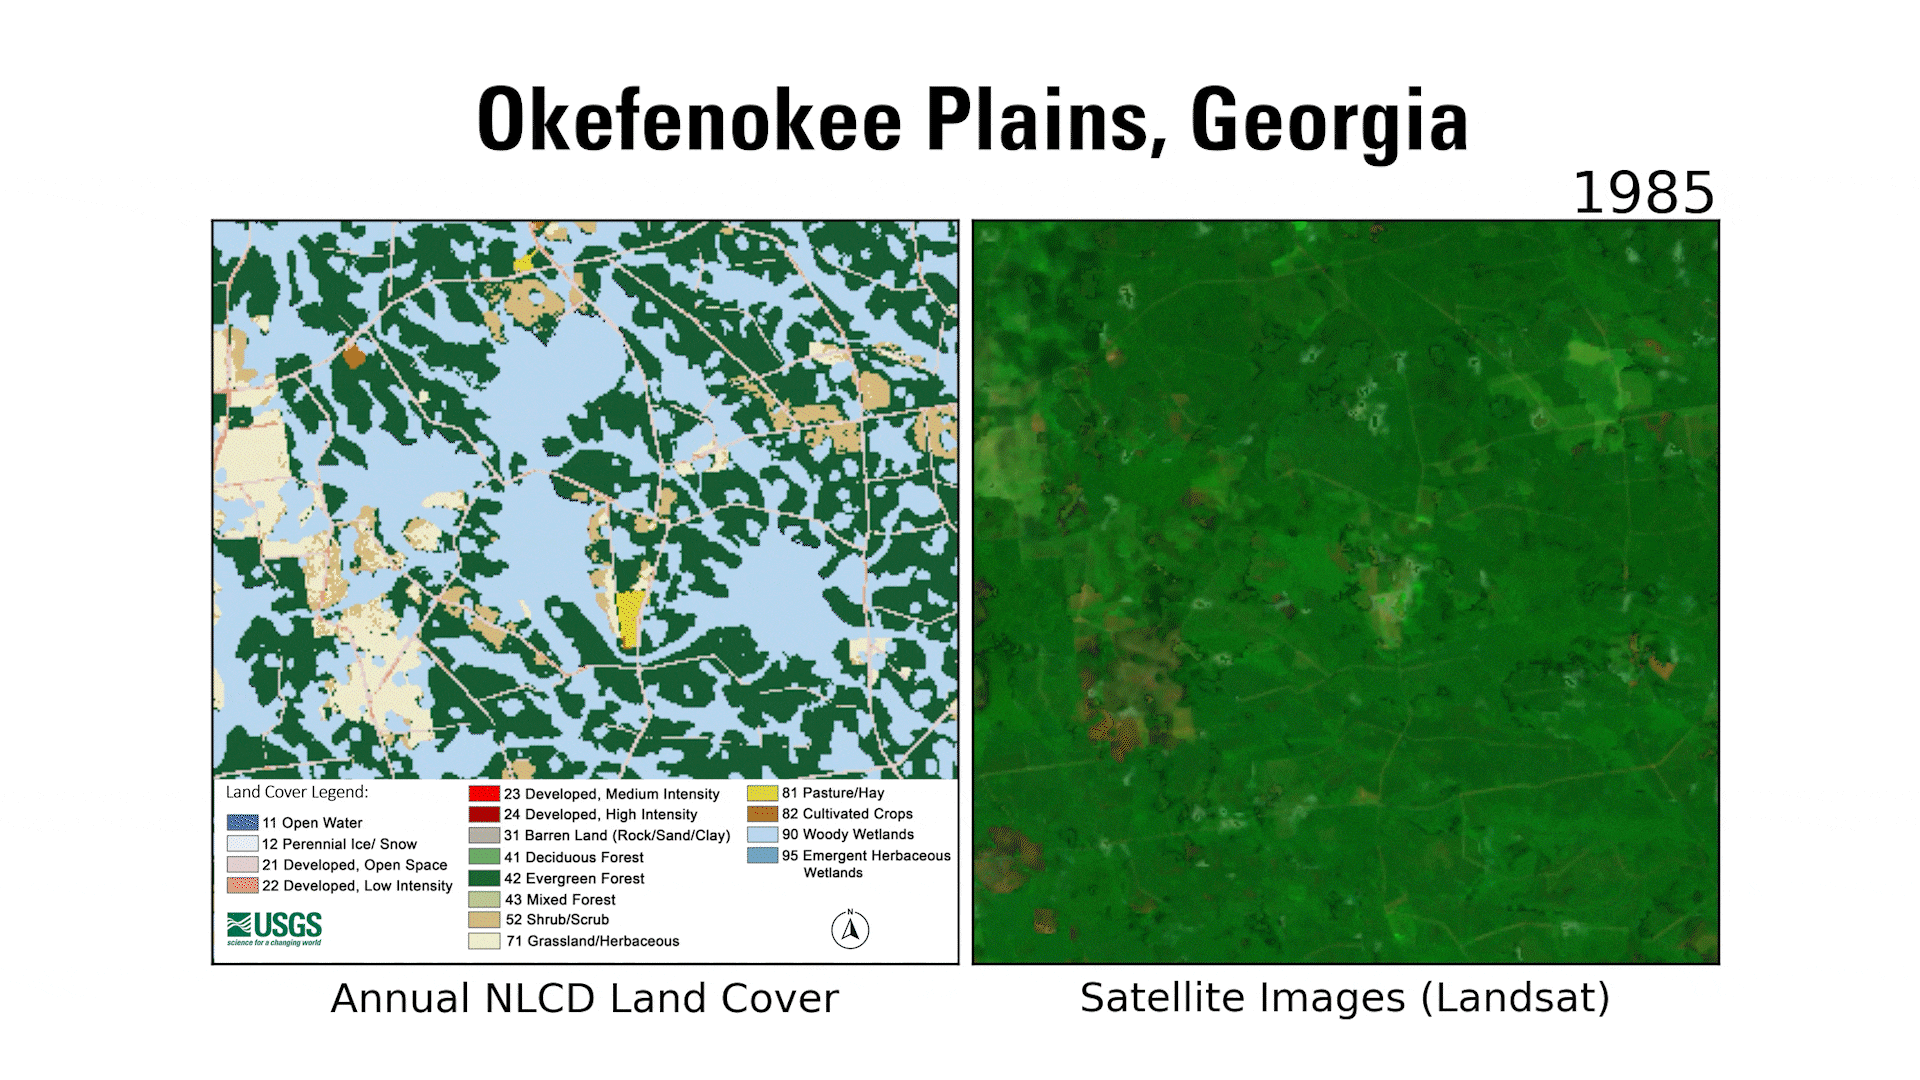
Annual NLCD and Landsat animations of a portion of the Okefenokee Plain
Annual NLCD and Landsat animations of a portion of the Okefenokee PlainAnnual National Land Cover Database (NLCD) and Landsat animations of a portion of the Okefenokee Plain in Georgia.
Annual NLCD and Landsat animations of a portion of the Okefenokee Plain
Annual NLCD and Landsat animations of a portion of the Okefenokee PlainAnnual National Land Cover Database (NLCD) and Landsat animations of a portion of the Okefenokee Plain in Georgia.
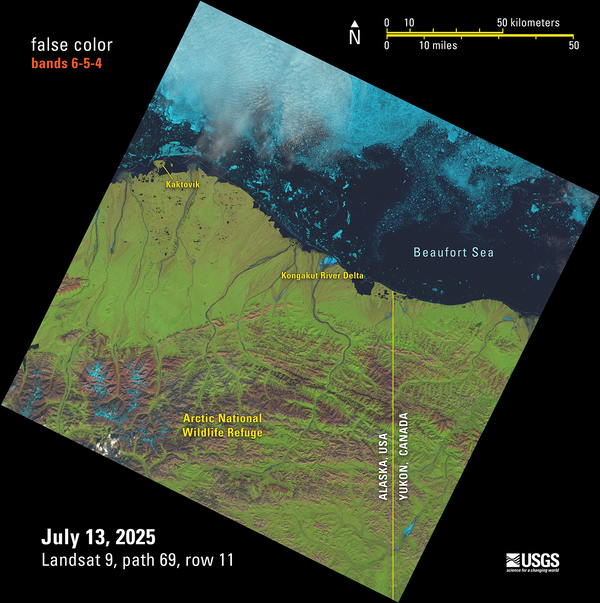
Landsat 9 False Color Image of the Beaufort Sea Shoreline
Landsat 9 False Color Image of the Beaufort Sea ShorelineThis Landsat 9 image showing the Beaufort Sea shoreline off of Alaska and Canada is just one of the scenes captured and processed on July 13, 2025— that day, the USGS EROS archive reached a milestone of one million Landsat 9 Level-1 products. This false color image was made with bands 6,5, and 4 from the Operational Land Imager.
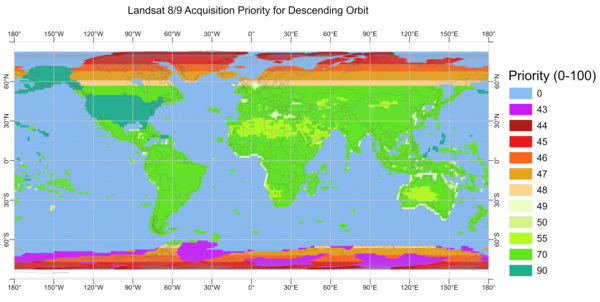
Landsat 8-9 Descending Acquisition Priority Map
This map displays the geographic coverage of descending (daytime) image acquisition priorities for Landsat 8 and Landsat 9 on a typical day. The priority scale denotes 0 (low priority) to 100 (high priority).
This map displays the geographic coverage of descending (daytime) image acquisition priorities for Landsat 8 and Landsat 9 on a typical day. The priority scale denotes 0 (low priority) to 100 (high priority).
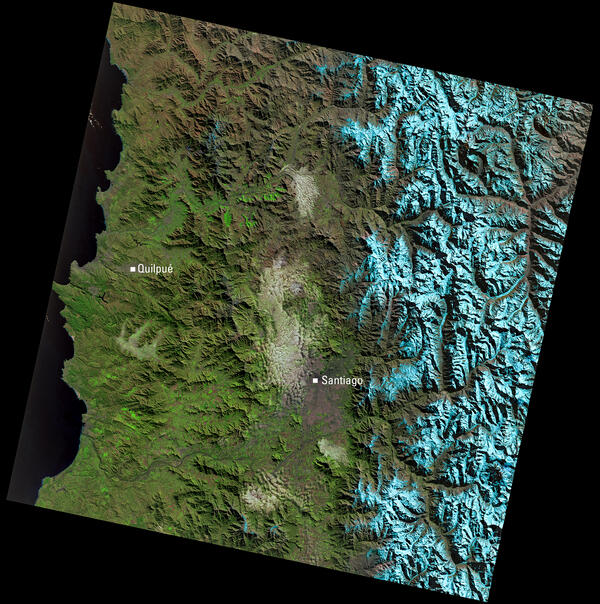
Landsat View of Central Chile and the Andes Mountains
Landsat View of Central Chile and the Andes MountainsThis Landsat 9 image of central Chile, acquired July 10, 2025, uses the shortwave infrared, near infrared, and red spectral bands ( bands 6,5,4) to highlight land cover. In this combination, healthy vegetation appears bright green, while snow and ice in the Andes Mountains show in bright blue.

Landsat 7 Mission - by the Numbers
The Landsat 7 satellite was launched on April 15, 1999. The mission was decommissioned on June 4, 2025. The data collected by the satellite's sensor from 1999 to 2024 is a key part of Landsat’s 50-plus year record of imaging our planet’s surface and are preserved in the USGS Earth Resources Observation and Science (EROS) Center archive.
The Landsat 7 satellite was launched on April 15, 1999. The mission was decommissioned on June 4, 2025. The data collected by the satellite's sensor from 1999 to 2024 is a key part of Landsat’s 50-plus year record of imaging our planet’s surface and are preserved in the USGS Earth Resources Observation and Science (EROS) Center archive.

Water ribbons and shoals near the Marquesas Keys
The Marquesas Keys are situated at the western edge of the Key West National Wildlife Refuge in Florida and are part of the Florida Keys Wilderness. The islands are at a low elevation (about 6-10 feet above sea level), and have beaches tangled with mangroves that allow protection for wildlife resources.
The Marquesas Keys are situated at the western edge of the Key West National Wildlife Refuge in Florida and are part of the Florida Keys Wilderness. The islands are at a low elevation (about 6-10 feet above sea level), and have beaches tangled with mangroves that allow protection for wildlife resources.
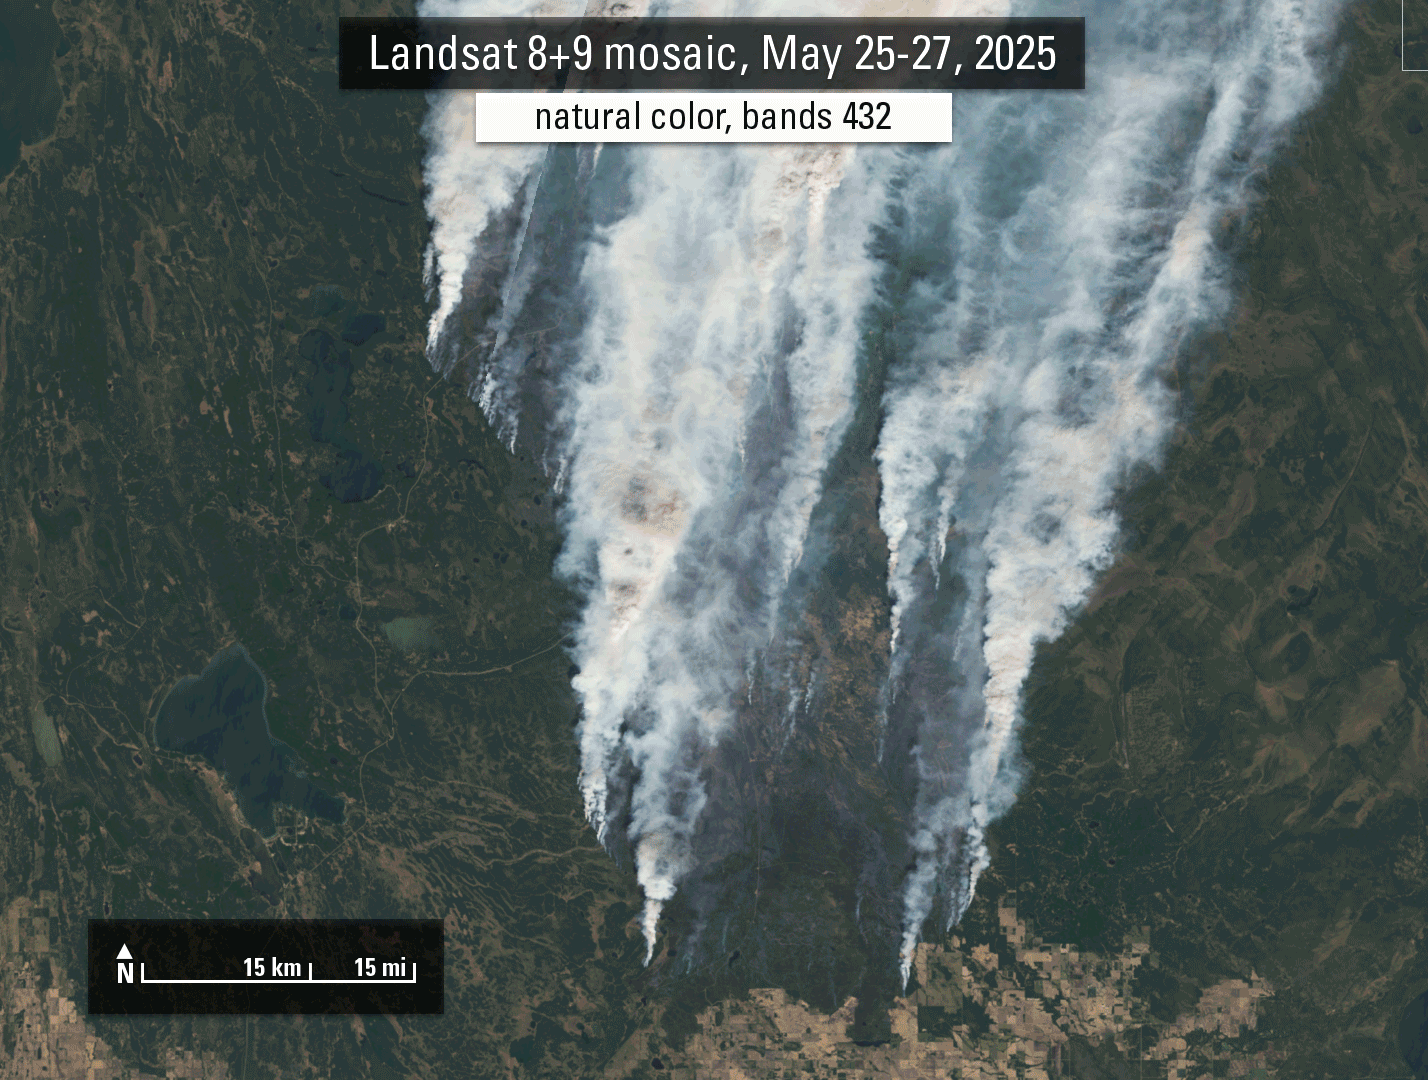
Animation of Landsat images showing fires burning in Saskatchewan, Canada
Animation of Landsat images showing fires burning in Saskatchewan, CanadaIn late May 2025, Landsat satellites captured imagery of active fires in north-central Saskatchewan, Canada. The fires have caused evacuation orders and closed highways. While the natural color image shows the massive smoke covering the land, false color images allow us to see through the smoke and see the areas of active burning more clearly.
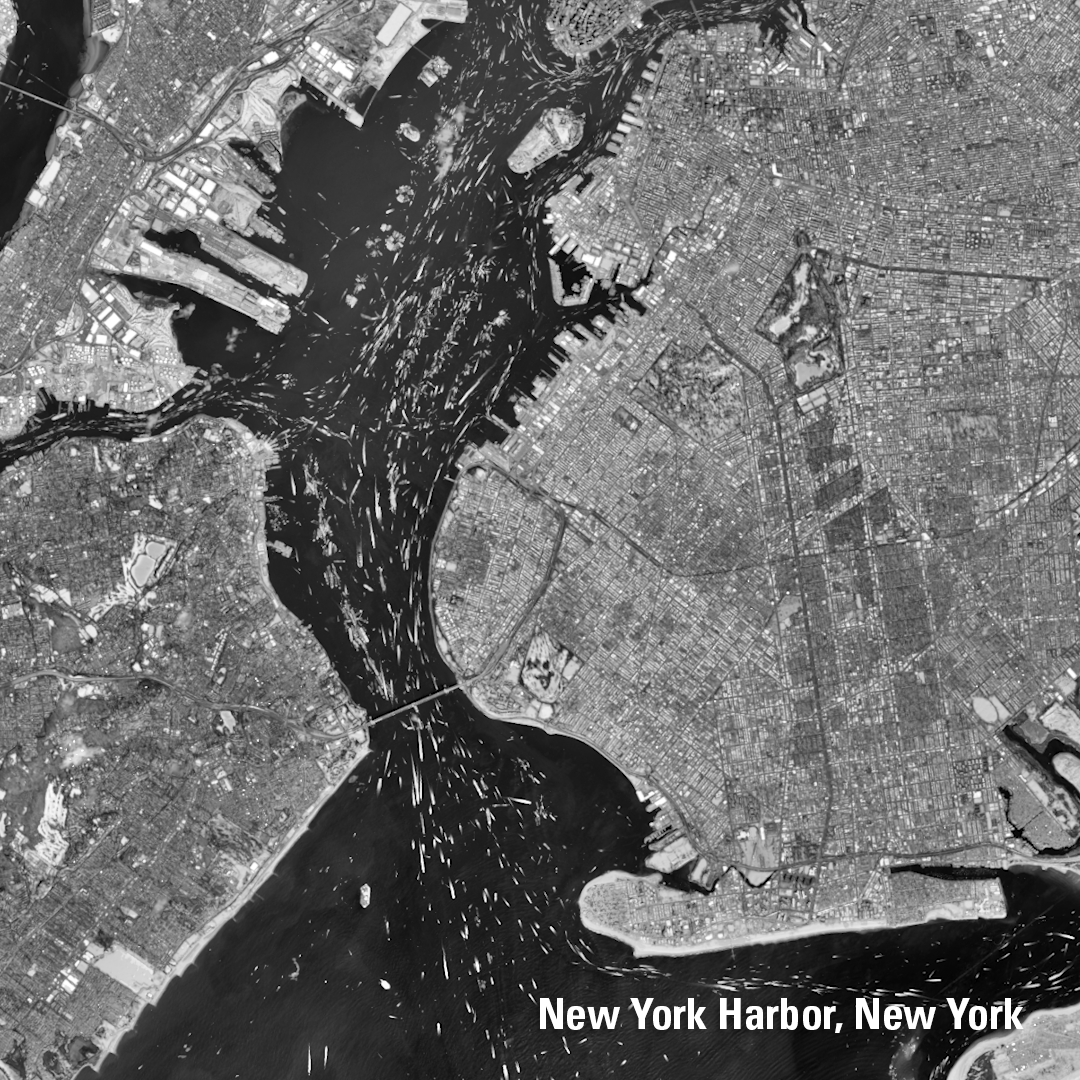
Animation of Landsat images of ships in U.S. harbors
Animation of Landsat images of ships in U.S. harborsBy layering over 10 years of cloud-free Landsat 8 and Landsat 9 images, we can see the bright trails of ship traffic in major U.S. ports and harbors. Check out these striking patterns from popular shipping waterways, captured using Landsat’s panchromatic band. Just another example of how Landsat helps us understand the world from above.

The BigMAC Exercise Site
This picture is the site of the Big Multi-Agency Campaign (BigMAC), a comprehensive field exercise aimed at assessing current technologies that might be used for validation of surface products derived from satellite imagery, The exercise was held in Brookings, South Dakota in August 2021.
This picture is the site of the Big Multi-Agency Campaign (BigMAC), a comprehensive field exercise aimed at assessing current technologies that might be used for validation of surface products derived from satellite imagery, The exercise was held in Brookings, South Dakota in August 2021.
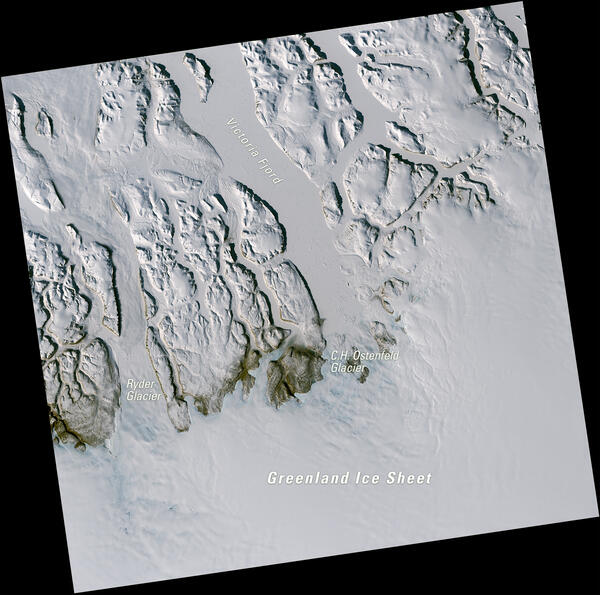
Landsat View of Glaciers and Fjords in Northern Greenland
Landsat View of Glaciers and Fjords in Northern GreenlandThis Landsat 8 image of northern Greenland, acquired May 10, 2025, uses the natural color combination of red, green, and blue spectral bands (bands 4,3,2). Snow and ice appear bright white and exposed rock appears brown. The scene features the Ryder Glacier, C.H. Ostenfeld Glacier, and Victoria Fjord, along with part of the Greenland Ice Sheet.
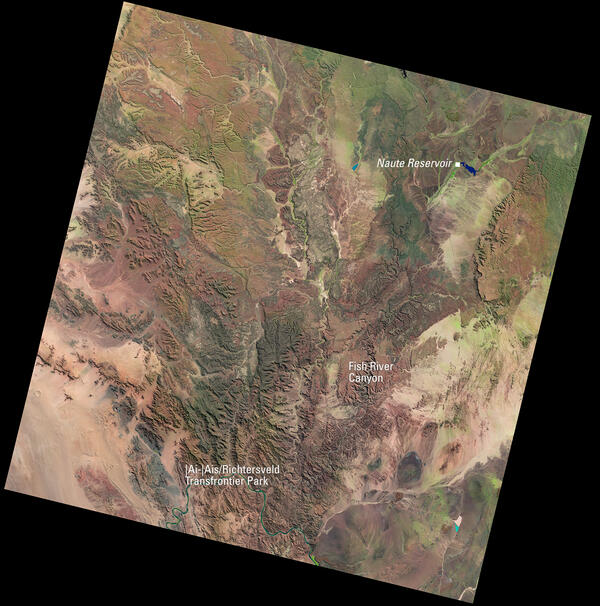
Landsat View of Namibia’s Fish River Canyon and ǀAi-ǀAis / Richtersveld Transfrontier Park
Landsat View of Namibia’s Fish River Canyon and ǀAi-ǀAis / Richtersveld Transfrontier ParkThis Landsat 8 image of southern Namibia, acquired May 7, 2025, uses the shortwave infrared, near infrared, and red spectral bands (bands 6,5,4) to highlight land cover. In this combination, healthy vegetation appears bright green, while bare ground and desert landscapes show in shades of brown and tan.

Landsat's View of the USA image
How does your state use Landsat satellite data? Visit the Landsat’s View of the USA webpage to find how Landsat benefits each of United States. You can download a satellite image, put together an online puzzle, or read a USGS Fact Sheet for your selected state!
How does your state use Landsat satellite data? Visit the Landsat’s View of the USA webpage to find how Landsat benefits each of United States. You can download a satellite image, put together an online puzzle, or read a USGS Fact Sheet for your selected state!