Attachment H: FY23 FAA Multi-Year 3DEP Priority Areas
Attachment H: FY23 FAA Multi-Year 3DEP Priority AreasAttachment H: FY23 FAA Multi-Year 3DEP Priority Areas for Data Acquisition


Official websites use .gov
A .gov website belongs to an official government organization in the United States.

Secure .gov websites use HTTPS
A lock () or https:// means you’ve safely connected to the .gov website. Share sensitive information only on official, secure websites.

Core Science Systems images.

Attachment H: FY23 FAA Multi-Year 3DEP Priority Areas for Data Acquisition
Attachment H: FY23 FAA Multi-Year 3DEP Priority Areas for Data Acquisition

Attachment H: FY23 FEMA Multi-Year 3DEP Priority Areas for Data Acquisition
Attachment H: FY23 FEMA Multi-Year 3DEP Priority Areas for Data Acquisition

Attachment H: FY23 USFWS Multi-Year 3DEP Priority Areas for Data Acquisition
Attachment H: FY23 USFWS Multi-Year 3DEP Priority Areas for Data Acquisition

Attachment H: FY23 NOAA Multi-Year 3DEP Priority Areas
Attachment H: FY23 NOAA Multi-Year 3DEP Priority Areas

Attachment H: FY23 NPS Multi-Year 3DEP Priority Areas
Attachment H: FY23 NPS Multi-Year 3DEP Priority Areas

Attachment H: FY23 OSMRE Multi-Year 3DEP Priority Areas
Attachment H: FY23 OSMRE Multi-Year 3DEP Priority Areas

Attachment H: FY23 USFS Multi-Year 3DEP Priority Areas
Attachment H: FY23 USFS Multi-Year 3DEP Priority Areas

Attachment H: FY23 USGS Multi-Year 3DEP Priority Areas
Attachment H: FY23 USGS Multi-Year 3DEP Priority Areas

Landsat 9 image of Hurricane Ian as the eye of the storm passed north of Cuba on the morning of Tuesday, September 27, 2022. The image has the island boundary overlaid on it. Image credit: USGS EROS
Landsat 9 image of Hurricane Ian as the eye of the storm passed north of Cuba on the morning of Tuesday, September 27, 2022. The image has the island boundary overlaid on it. Image credit: USGS EROS

The 3D Nation Elevation Requirements and Benefits Study was performed to document national requirements for improved topographic and bathymetric elevation data, estimate the benefits and costs of meeting these requirements, and evaluate multiple national 3D elevation program implementation scenarios.
The 3D Nation Elevation Requirements and Benefits Study was performed to document national requirements for improved topographic and bathymetric elevation data, estimate the benefits and costs of meeting these requirements, and evaluate multiple national 3D elevation program implementation scenarios.

The NHDPlus HR National presents a continuous representation of the most recent NHDPlus HR vector data for the contiguous United States, Puerto Rico, Hawaii, and parts of Alaska.
The NHDPlus HR National presents a continuous representation of the most recent NHDPlus HR vector data for the contiguous United States, Puerto Rico, Hawaii, and parts of Alaska.

This is a graph and illustration representation of the 3DHP Proposed Nine Year Costs
This is a graph and illustration representation of the 3DHP Proposed Nine Year Costs

By the end of December 2022, all Landsat Collection 1 data and science products will be removed from USGS data access platforms. This depreciation includes Level-1, Level-2, Level-3, and ESPA- related products. Collection 1 has not been updated with Landsat products since December 31, 2021.
By the end of December 2022, all Landsat Collection 1 data and science products will be removed from USGS data access platforms. This depreciation includes Level-1, Level-2, Level-3, and ESPA- related products. Collection 1 has not been updated with Landsat products since December 31, 2021.

Landsat 7 image acquired on August 14, 2022 showing the Vall d'Ebo Fire near Pego, Spain. The gap-filled image is shown using the short wave infrared, near infrared, and red bands (Bands 5|4|3). This image was acquired as part of the Landsat 7 extended science mission which acquires data at 8 kilometers lower than the original science mission.
Landsat 7 image acquired on August 14, 2022 showing the Vall d'Ebo Fire near Pego, Spain. The gap-filled image is shown using the short wave infrared, near infrared, and red bands (Bands 5|4|3). This image was acquired as part of the Landsat 7 extended science mission which acquires data at 8 kilometers lower than the original science mission.

This paper presents dynamic surface water products over Canada from the first in a series of satellite sensors that will be used to develop a multi-sensor dynamic surface water monitoring system. The dataset uses 1984 to 2019 Landsat data to create annual water masks, inundation frequency and wetting/drying trends.
This paper presents dynamic surface water products over Canada from the first in a series of satellite sensors that will be used to develop a multi-sensor dynamic surface water monitoring system. The dataset uses 1984 to 2019 Landsat data to create annual water masks, inundation frequency and wetting/drying trends.

The Aorounga Crater located in Chad, Africa is a large impact crater that appears as a circular depression surrounded by a raised rim, as seen in this Landsat 9 image. The crater is surrounded by a vast expanse of desert and is known for its unique rock ridges, known as yardangs.
The Aorounga Crater located in Chad, Africa is a large impact crater that appears as a circular depression surrounded by a raised rim, as seen in this Landsat 9 image. The crater is surrounded by a vast expanse of desert and is known for its unique rock ridges, known as yardangs.

Landsat Updates are prepared periodically and distributed electronically to provide information about Landsat activities and related topics of interest. Read this issue here.
Landsat Updates are prepared periodically and distributed electronically to provide information about Landsat activities and related topics of interest. Read this issue here.

Example of the Landsat Collection 2 Provisional Evapotranspiration science product for agricultural fields on the Fucino plain near San Benedetto dei Marsi, Italy. Left: Landsat 9 Collection 2 Natural Color Surface Reflectance Image. Right: Landsat 9 Collection 2 Actual Evapotranspiration Image.
Example of the Landsat Collection 2 Provisional Evapotranspiration science product for agricultural fields on the Fucino plain near San Benedetto dei Marsi, Italy. Left: Landsat 9 Collection 2 Natural Color Surface Reflectance Image. Right: Landsat 9 Collection 2 Actual Evapotranspiration Image.

Examples of different radiometric resolutions over Chicago, Illinois. The left image is 16-bit radiometric resolution (65,536 discrete shades of grey), the center image is an 8-bit radiometric resolution (256 discrete shades of grey), the right image is 4-bit radiometric resolution (16 discrete shades of grey).
Examples of different radiometric resolutions over Chicago, Illinois. The left image is 16-bit radiometric resolution (65,536 discrete shades of grey), the center image is an 8-bit radiometric resolution (256 discrete shades of grey), the right image is 4-bit radiometric resolution (16 discrete shades of grey).
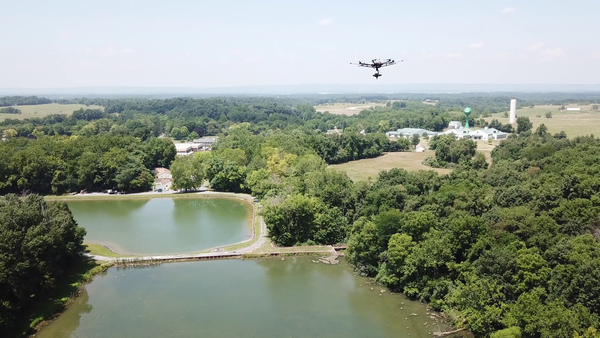
Uncrewed aircraft system (UAS) hyperspectral data collection flight over a reservoir at the Eastern USGS Eastern Ecological Science Center - Leetown Research Laboratory (EESC-LRL) in West Virginia.
Uncrewed aircraft system (UAS) hyperspectral data collection flight over a reservoir at the Eastern USGS Eastern Ecological Science Center - Leetown Research Laboratory (EESC-LRL) in West Virginia.

This Landsat 9 image, showing the Dallas - Fort Worth area of Texas, was acquired on July 15, 2022. This false-color image vegetated land in shades of red, whereas grays and whites indicate urban or rocky surfaces.
This Landsat 9 image, showing the Dallas - Fort Worth area of Texas, was acquired on July 15, 2022. This false-color image vegetated land in shades of red, whereas grays and whites indicate urban or rocky surfaces.