
Types of Water
Types of Water
Water In Space: How Does Water Behave in Outer Space?
Glaciers: Things To Know
Rain and Precipitation
Find water science information and activities by type of water body.

Rivers, Streams, and Creeks
Rivers, Streams, and Creeks

Water quality data from state, federal, tribal, and local agencies
Filter Total Items: 168

CASCaDE: Computational Assessments of Scenarios of Change for the Delta Ecosystem
The Delta of the Sacramento and San Joaquin rivers provides drinking water supplies to two-thirds of Californians, and is a fragile ecosystem home to threatened and endangered species. The CASCaDE project builds on several decades of USGS science to address the goals of achieving water supply reliability and restoring the ecosystems in the Bay-Delta system.

Groundwater-Level Response to Earthquakes
Did you know that earthquakes can cause changes in groundwater levels? Very large earthquakes can even cause water-level fluctuations in some wells thousands of miles away, depending on the local geological conditions around the well.

Karst Aquifers
Karst terrain is created from the dissolution of soluble rocks, principally limestone and dolomite. Karst areas are characterized by distinctive landforms (like springs, caves, sinkholes) and a unique hydrogeology that results in aquifers that are highly productive but extremely vulnerable to contamination.

Integrated Water Science (IWS) Basins
The U.S. Geological Survey is integrating its water science programs to better address the Nation’s greatest water resource challenges. At the heart of this effort are plans to intensively study several Integrated Water Science (IWS) basins—medium-sized watersheds (10,000-20,000 square miles) and underlying aquifers—over the next decade. The IWS basins will represent a wide range of environmental...

Next Generation Water Observing System (NGWOS)
The Next Generation Water Observing System (NGWOS) supports water availability assessments, management, and prediction by enhancing water observations in basins that represent major U.S. hydrologic regions. NGWOS provides high-resolution, real-time data on water quantity, quality, and use, as well as advance the development and application of new sensor technologies and remote sensing methods.

Next Generation Water Observing System: Illinois River Basin
The Next Generation Water Observing System provides high-fidelity, real-time data on water quantity, quality, and use to support modern water prediction and decision-support systems that are necessary for informing water operations on a daily basis and decision-making during water emergencies. The Illinois River Basin provides an opportunity to implement the NGWOS in a system challenged by an...

Next Generation Water Observing System: Upper Colorado River Basin
The Next Generation Water Observing System (NGWOS) provides high-fidelity, real-time data on water quantity, quality, and use to support modern prediction and decision-support systems that are necessary for informing water operations on a daily basis and decision-making during water emergencies. The headwaters of the Colorado and Gunnison River Basins provide an opportunity to implement NGWOS in a...

Next Generation Water Observing System: Delaware River Basin
The Next Generation Water Observing System (NGWOS) supports water availability assessments, management, and prediction by enhancing water observations in basins that represent major U.S. hydrologic regions. The Delaware River Basin was the first Integrated Water Science basin selected, providing an opportunity to implement the NGWOS program in a nationally important, complex interstate river...

Sampling Methods for the Water Quality of San Francisco Bay Project
The Water Quality of San Francisco Bay Research and Monitoring Project measures changes in water quality along the deep channel of the San Francisco Bay-Delta system using submersible sensors and discrete water samples. Learn more about how we collect and measure water-quality data.

Research Vessel David H. Peterson
The Research Vessel David H. Peterson begain service with the U.S. Geological Survey in 2015. Named after a founder of the Water Quality of San Francisco Bay Research and Monitoring Project, this vessel is a high-tech scientific platform for estuarine research. Learn more about how the R/V David H. Peterson makes our research possible.
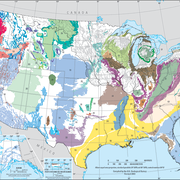
Principal Aquifers of the United States
This website compiles USGS resources and data related to principal aquifers including Aquifer Basics, principal aquifers maps and GIS data, and the National Aquifer Code Reference List.

National Aquifer Code Reference List
This list of national principal aquifer codes and names are fixed values assigned by the National Water Information System (NWIS). Aquifers are identified by a geohydrologic unit code - a three-digit number related to the age of the formation, followed by a 4 or 5 character abbreviation for the geologic unit or aquifer name.