Screenshot of USGS Hurricane Helene Landslide Photo Viewer
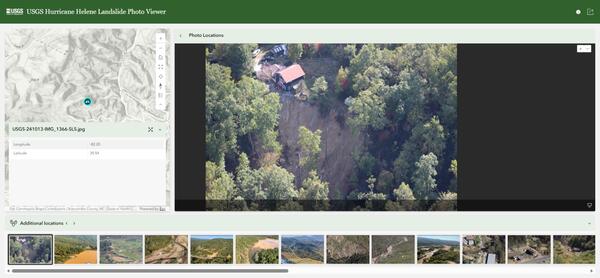
Screenshot of USGS Hurricane Helene Landslide Photo ViewerScreenshot of the USGS Hurricane Helene Landslide Photo Viewer taken on 7/28/2026.

Official websites use .gov
A .gov website belongs to an official government organization in the United States.
Secure .gov websites use HTTPS
A lock () or https:// means you’ve safely connected to the .gov website. Share sensitive information only on official, secure websites.
Browse our photos of landslide research and post-landslide investigations.
Screenshot of the USGS Hurricane Helene Landslide Photo Viewer taken on 7/28/2026.
Screenshot of the USGS Hurricane Helene Landslide Photo Viewer taken on 7/28/2026.
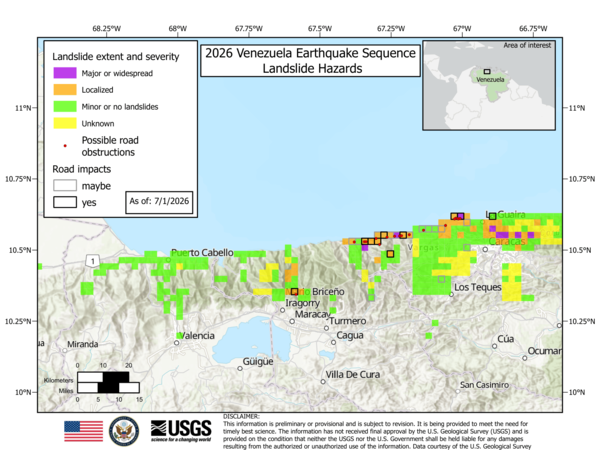
USGS Imagery assessment of landslide extent and severity (as of 07/01/26, 4:30 PM MDT). Verification remains ongoing. Color is based on USGS’s remote assessment. Landslide impact is classified as “Unknown” (yellow), “Minor or none” (green), “Localized” (orange), or “Major or Widespread” (purple).
USGS Imagery assessment of landslide extent and severity (as of 07/01/26, 4:30 PM MDT). Verification remains ongoing. Color is based on USGS’s remote assessment. Landslide impact is classified as “Unknown” (yellow), “Minor or none” (green), “Localized” (orange), or “Major or Widespread” (purple).
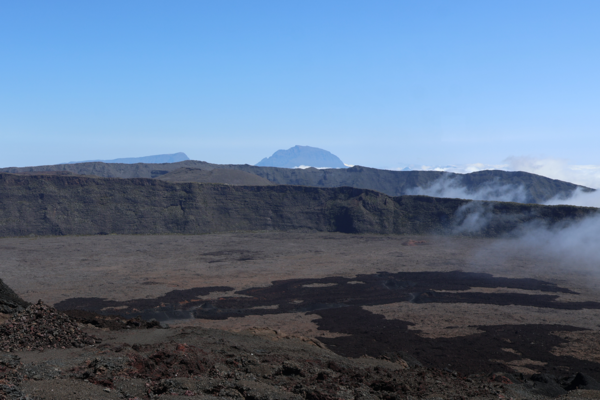
Photograph taken from the western flank of the Piton de la Fournaise (Reunion Island, Indian Ocean) looking westward to Piton des Neiges. Cliffs in image are scarps associated with previous edifice collapses.
Photograph taken from the western flank of the Piton de la Fournaise (Reunion Island, Indian Ocean) looking westward to Piton des Neiges. Cliffs in image are scarps associated with previous edifice collapses.
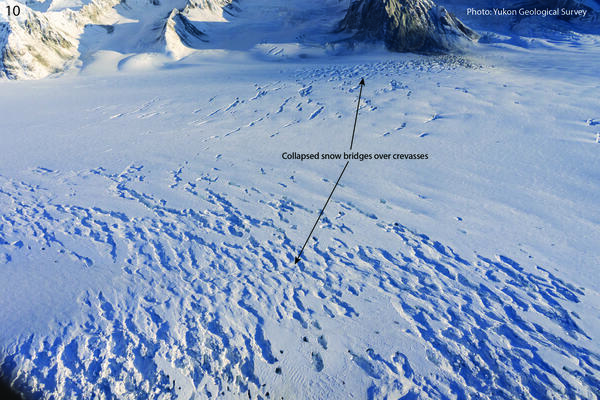
Collapsed snow bridges on crevasse field on the Hubbard Glacier between McArthur Peak and Mt. King George. Photo courtesy of Yukon Geological Survey.
Collapsed snow bridges on crevasse field on the Hubbard Glacier between McArthur Peak and Mt. King George. Photo courtesy of Yukon Geological Survey.
Collapsed snow bridges on crevasse field on the Hubbard Glacier between McArthur Peak and Mt. King George. Photo courtesy of Yukon Geological Survey.
Collapsed snow bridges on crevasse field on the Hubbard Glacier between McArthur Peak and Mt. King George. Photo courtesy of Yukon Geological Survey.
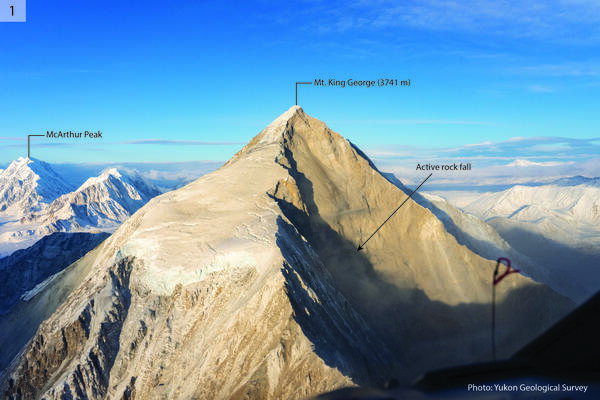
Recent landslide on the east face of Mt. King George (3741 m) with clouds of dust from ongoing rockfall. Debris descended over 1500 m to the glacier below. Photo courtesy of Yukon Geological Survey.
Recent landslide on the east face of Mt. King George (3741 m) with clouds of dust from ongoing rockfall. Debris descended over 1500 m to the glacier below. Photo courtesy of Yukon Geological Survey.
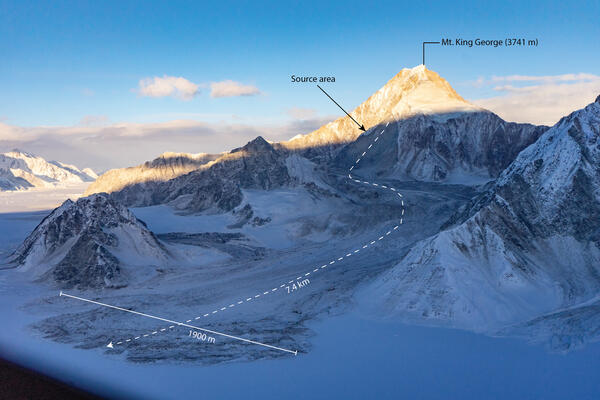
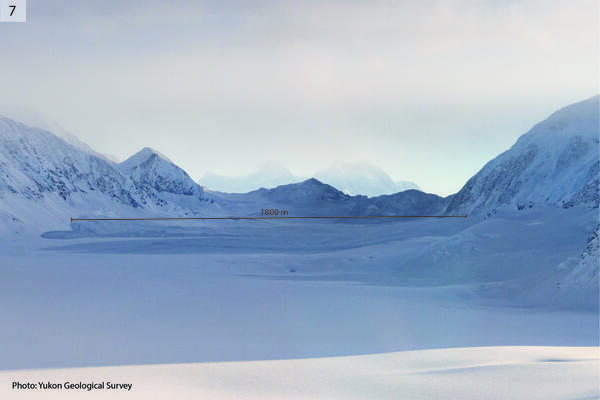
Large landslide on the southwest side of Mt. King George. The main debris lobe is 1800 m wide, and material would have travelled approximately 6 km from the source area (triangular scar) in the background. Photo courtesy of Yukon Geological Survey.
Large landslide on the southwest side of Mt. King George. The main debris lobe is 1800 m wide, and material would have travelled approximately 6 km from the source area (triangular scar) in the background. Photo courtesy of Yukon Geological Survey.
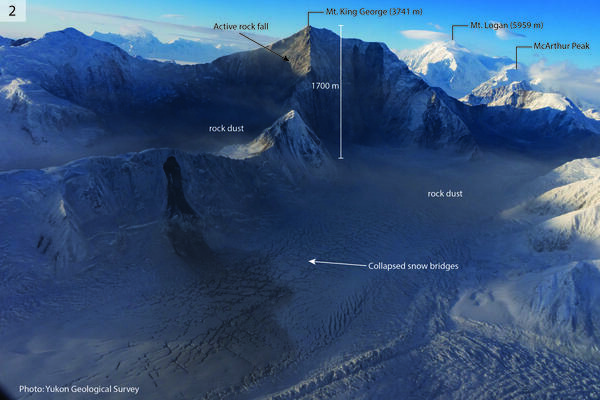
Landslides on the northeast side of Mt. King George with clouds of rock dust in the air caused by ongoing activity. Elevation difference between the peak and the glacier is at least 1700 m. Also note the numerous collapsed snow bridges on the glacier. Photo courtesy of Yukon Geological Survey.
Landslides on the northeast side of Mt. King George with clouds of rock dust in the air caused by ongoing activity. Elevation difference between the peak and the glacier is at least 1700 m. Also note the numerous collapsed snow bridges on the glacier. Photo courtesy of Yukon Geological Survey.
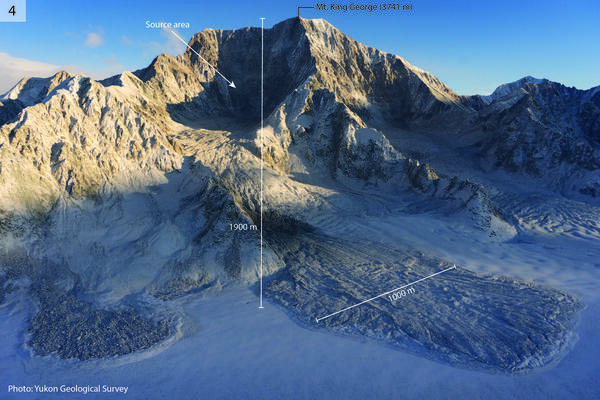
Large landslides on the southwest side of Mt. King George. The main debris lobe on the right is approximately 1000 m wide. The elevation difference between the peak and the glacier is approximately 1900 m. Photo courtesy of Yukon Geological Survey.
Large landslides on the southwest side of Mt. King George. The main debris lobe on the right is approximately 1000 m wide. The elevation difference between the peak and the glacier is approximately 1900 m. Photo courtesy of Yukon Geological Survey.
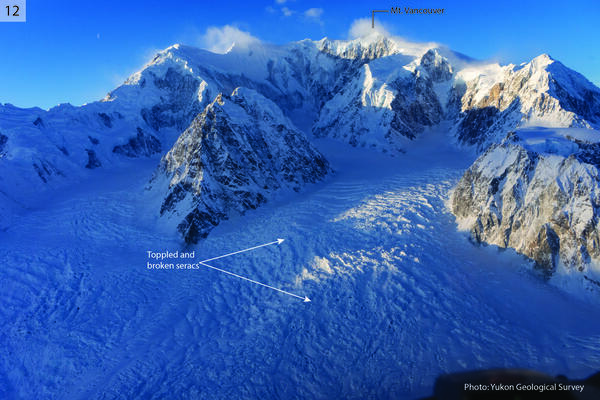
Seracs in an icefall on the east side of Mt. Vancouver (4812 m), toppled by shaking. Field of view is approximately 3.5 km wide. Photo courtesy of Yukon Geological Survey.
Seracs in an icefall on the east side of Mt. Vancouver (4812 m), toppled by shaking. Field of view is approximately 3.5 km wide. Photo courtesy of Yukon Geological Survey.
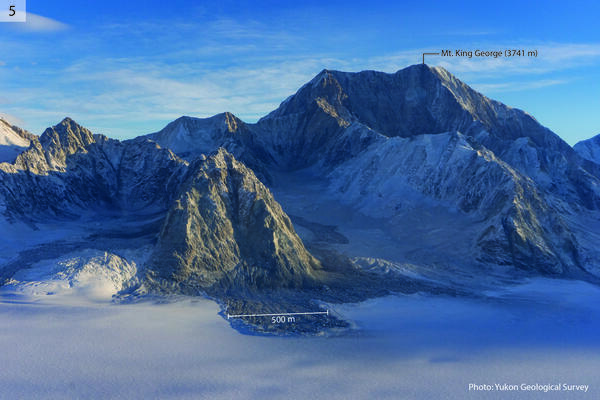
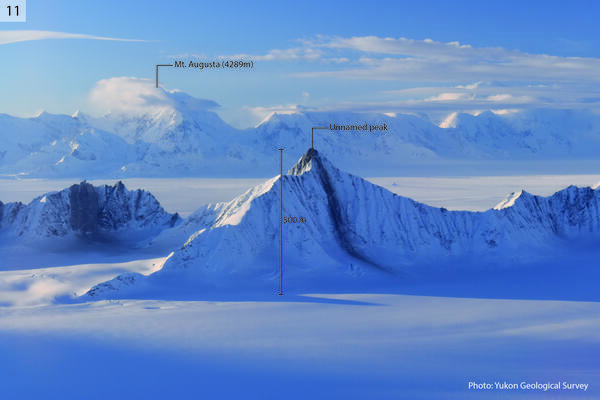
Landslides on the west side of Mt. King George. The central debris lobe is 500 m wide. Photo courtesy of Yukon Geological Survey.
Landslides on the west side of Mt. King George. The central debris lobe is 500 m wide. Photo courtesy of Yukon Geological Survey.
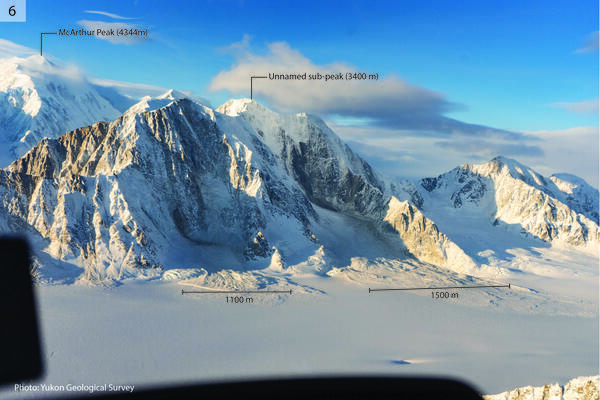
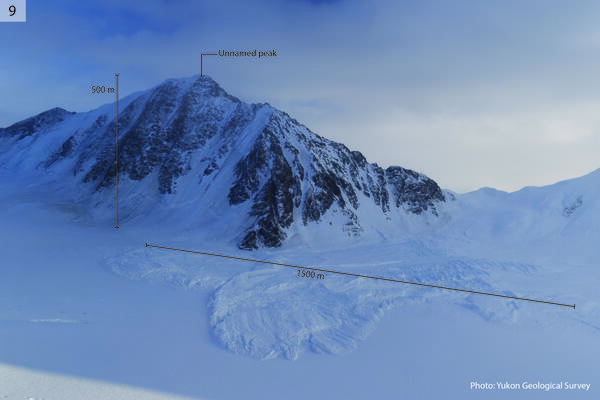
Landslides and avalanches on the east side of McArthur Peak. The left-hand debris lobe is 1100 m wide, and the right-hand debris lobe is 1500 m wide. The elevation difference between the peak and the glacier is approximately 1500 m. Photo courtesy of Yukon Geological Survey.
Landslides and avalanches on the east side of McArthur Peak. The left-hand debris lobe is 1100 m wide, and the right-hand debris lobe is 1500 m wide. The elevation difference between the peak and the glacier is approximately 1500 m. Photo courtesy of Yukon Geological Survey.
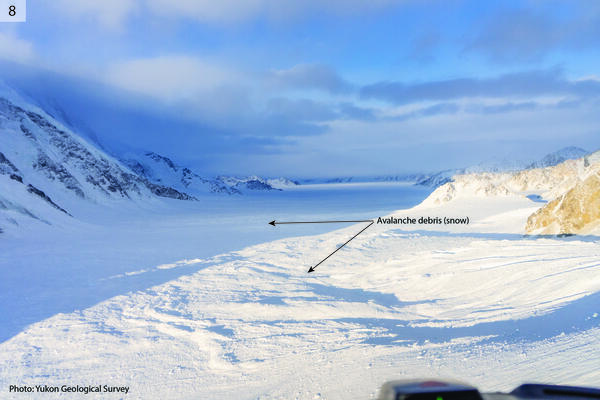
Snow avalanche on the north side of Mt. King George. The debris lobe is 1800 m long and runs up onto the hillside across the valley. Photo courtesy of Yukon Geological Survey.
Snow avalanche on the north side of Mt. King George. The debris lobe is 1800 m long and runs up onto the hillside across the valley. Photo courtesy of Yukon Geological Survey.
Snow avalanches in the valley on the east side of McArthur Peak. Photo courtesy of Yukon Geological Survey.
Snow avalanches in the valley on the east side of McArthur Peak. Photo courtesy of Yukon Geological Survey.
Large snow avalanche in valley east of McArthur Peak. Debris lobe is 1500 m wide. Photo courtesy of Yukon Geological Survey.
Large snow avalanche in valley east of McArthur Peak. Debris lobe is 1500 m wide. Photo courtesy of Yukon Geological Survey.
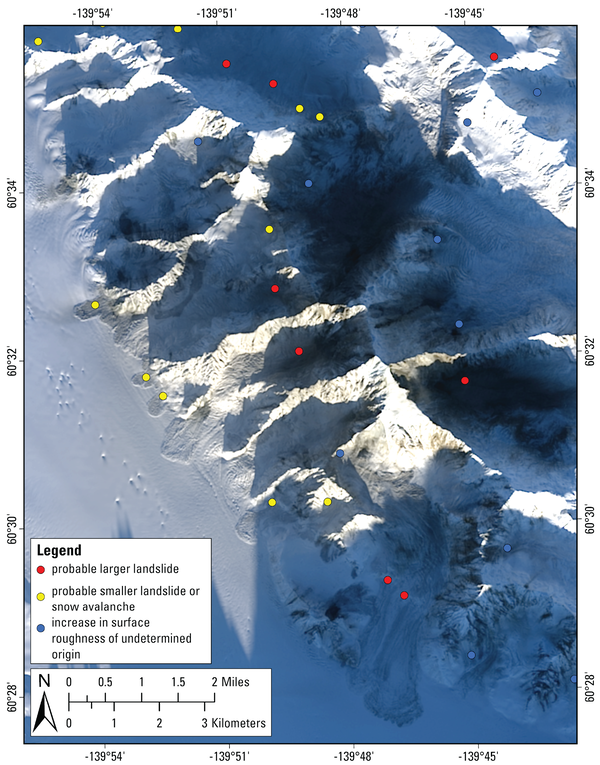
Landsat 9 true color, pan-sharpened satellite image collected on December 10, 2025, showing landslides triggered by the M7.0 Hubbard Glacier Earthquake on the slopes of Mount King George. Landslide points were mapped from SAR change detection.
Landsat 9 true color, pan-sharpened satellite image collected on December 10, 2025, showing landslides triggered by the M7.0 Hubbard Glacier Earthquake on the slopes of Mount King George. Landslide points were mapped from SAR change detection.
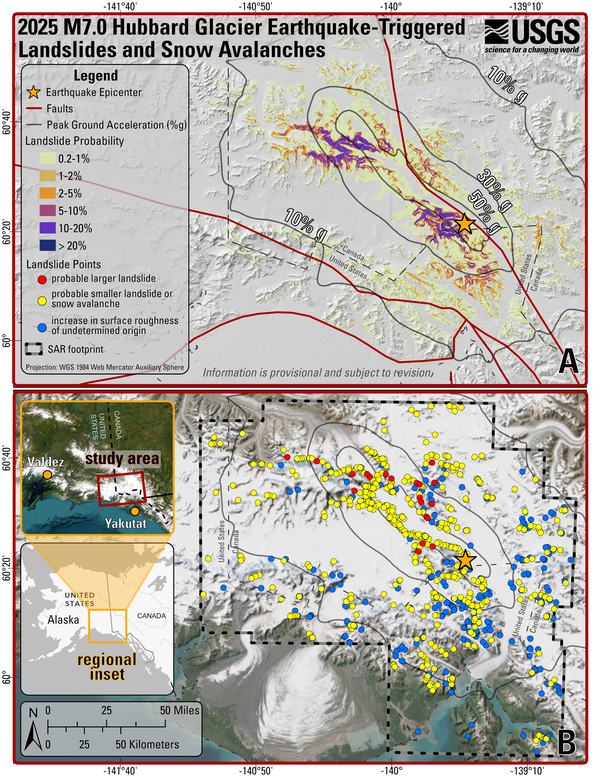
Overview maps at the same scale showing the epicenter of the M7.0 Hubbard Glacier Earthquake and modeled peak ground acceleration contours. A) shows the probability of landslides triggered by the earthquake and mapped faults, and B) shows the locations of landslides mapped using synthetic aperture radar (SAR) change detection.
Overview maps at the same scale showing the epicenter of the M7.0 Hubbard Glacier Earthquake and modeled peak ground acceleration contours. A) shows the probability of landslides triggered by the earthquake and mapped faults, and B) shows the locations of landslides mapped using synthetic aperture radar (SAR) change detection.
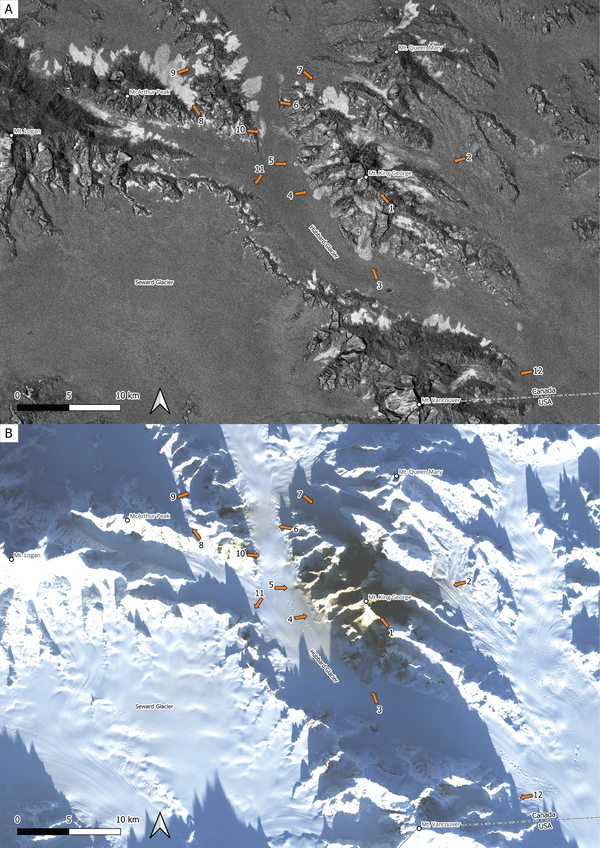
A) Map of Sentinel-1 radar surface roughness change with photo locations and azimuths. B) Landsat 8 optical imagery from December 11, 2025, with photo locations and azimuths.
A) Map of Sentinel-1 radar surface roughness change with photo locations and azimuths. B) Landsat 8 optical imagery from December 11, 2025, with photo locations and azimuths.
Animation of Sentinel-1 radar backscatter satellite imagery from November 28th and December 9th, 2025, showing the changes in surface roughness after the M7.0 Hubbard Glacier Earthquake. The lighter regions have rougher surface areas. The colored points correspond to preliminary mapping of potential mass movements.
Animation of Sentinel-1 radar backscatter satellite imagery from November 28th and December 9th, 2025, showing the changes in surface roughness after the M7.0 Hubbard Glacier Earthquake. The lighter regions have rougher surface areas. The colored points correspond to preliminary mapping of potential mass movements.
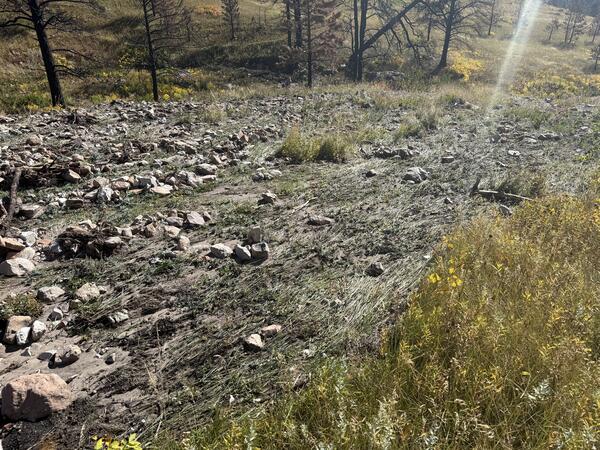
Postfire runoff in the 2024 Elk Fire buran area near Dayton, Wyoming. Near the outlet of a burned watershed, postfire runoff deposited small boulders and mud, flattening the vegetation in this low-relief area.
Postfire runoff in the 2024 Elk Fire buran area near Dayton, Wyoming. Near the outlet of a burned watershed, postfire runoff deposited small boulders and mud, flattening the vegetation in this low-relief area.
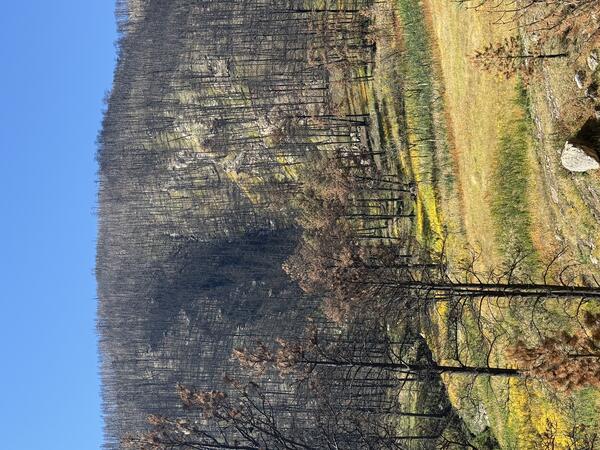
Upstream view of burned hillslopes in the Elk Fire burn area near Dayton, Wyoming. Burned trees, rocks, and rocky outcrops are visible on the slopes.
Upstream view of burned hillslopes in the Elk Fire burn area near Dayton, Wyoming. Burned trees, rocks, and rocky outcrops are visible on the slopes.