U.S. flag

An official website of the United States government

Images

Browse our photos of landslide research and post-landslide investigations.

Filter Total Items: 265
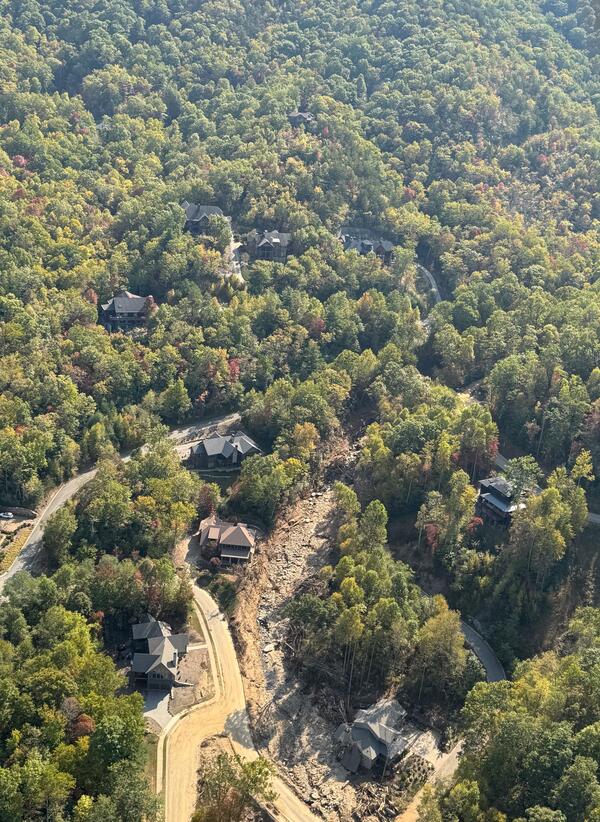
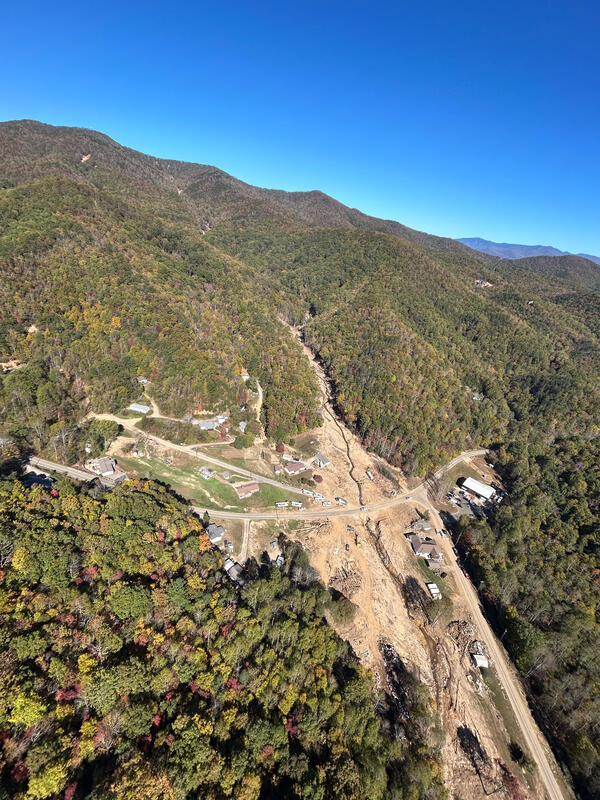
Aerial view of landslide and flood damage of rural neighborhood in the mountains
Landslide and flood damage near Zionville, NC. - 10/13/2024

Coordinates of photographer: Latitude: 36° 19’ 56.508” N Longitude: 81° 44’ 56.148” W

Date: 10/13/24

Caption: Landslide and flood damage near Zionville, NC.

Taken during Hurricane Helene LASER response
Coordinates of photographer: Latitude: 36° 19’ 56.508” N Longitude: 81° 44’ 56.148” W

Date: 10/13/24

Caption: Landslide and flood damage near Zionville, NC.

Taken during Hurricane Helene LASER response

aerial view of forested area with landslide path visible near houses and road
Aerial view of landslide triggered during Hurricane Helene

Oblique aerial view of a landslide near Black Mountain, North Carolina triggered by intense rainfall during Hurricane Helene in fall 2024. The photograph was collected during a U.S. Geological Survey aerial reconnaissance flight documenting widespread landsliding and flooding associated with the storm.

Oblique aerial view of a landslide near Black Mountain, North Carolina triggered by intense rainfall during Hurricane Helene in fall 2024. The photograph was collected during a U.S. Geological Survey aerial reconnaissance flight documenting widespread landsliding and flooding associated with the storm.

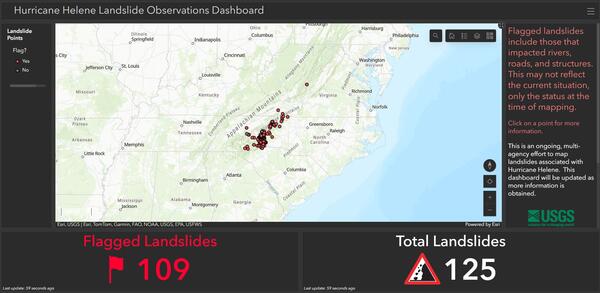
Screenshot of the Hurricane Helene Landslide Observations Dashboard on 10/2/2024 showing 109 flagged landslides and 125 total
10/3/2024 Screenshot of Hurricane Helene Landslide Observations Dashboard

USGS Hurricane Helene Landslide Dashboard. Screenshot taken on October 3, 2024 at 10:18pm UTC. This is an ongoing, multi-agency effort to map landslides from Hurricane Helene. This dashboard is updated as more information is available. 

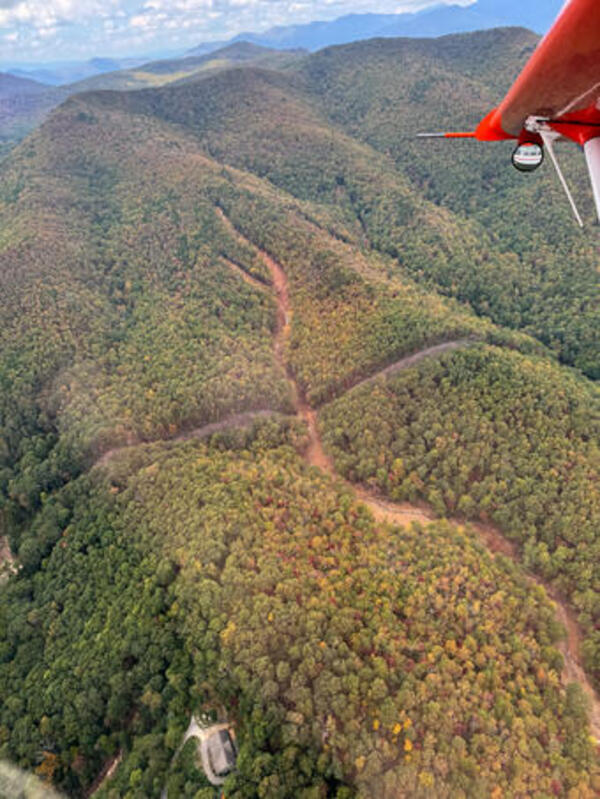
Aerial view of forested area with landslide
2024 Hurricane Helene debris flow

Oblique aerial view of a landslide near Fairview, North Carolina triggered by intense and prolonged rainfall during Hurricane Helene in fall 2024. The photograph was collected during a U.S. Geological Survey aerial reconnaissance flight documenting widespread landsliding and flooding associated with the storm.

Oblique aerial view of a landslide near Fairview, North Carolina triggered by intense and prolonged rainfall during Hurricane Helene in fall 2024. The photograph was collected during a U.S. Geological Survey aerial reconnaissance flight documenting widespread landsliding and flooding associated with the storm.

Map of the Hurricane Helene landslide hazard estimates with the highest hazard being around the mountains.
Hurricane Helene Landslide Hazard Estimate Map

Relative landslide hazard from Hurricane Helene. Dark purple shows locations expected to have experienced the highest landslide occurrence. Map based on cumulative precipitation estimate (NWS Greenville-Spartanburg from 9/24-9/28) and the USGS Landslide Susceptibility Map. 

Relative landslide hazard from Hurricane Helene. Dark purple shows locations expected to have experienced the highest landslide occurrence. Map based on cumulative precipitation estimate (NWS Greenville-Spartanburg from 9/24-9/28) and the USGS Landslide Susceptibility Map. 

where do landslides occur?
Where Do Landslides Occur?

A map of the United States including Hawaii, Alaska, and Puerto Rico shows landslide susceptibility from yellow (low) to red (high), where the areas without shading represent negligible potential for landslides.

A map of the United States including Hawaii, Alaska, and Puerto Rico shows landslide susceptibility from yellow (low) to red (high), where the areas without shading represent negligible potential for landslides.

¿Dónde Ocurren los Deslizamientos de Tierra?

¿Dónde Ocurren los Deslizamientos de Tierra?

(Mapa Nacional de Susceptibilidad a Deslizamientos de Tierra, 2024)

Photo showing damaged coniferous trees
2024 Pedersen Glacier Lagoon Landslide Damaged Trees

Damaged trees and debris deposited from the tsunami caused by the 2024 Pedersen Glacier lagoon landslide in Alaska.

Photo showing flattened vegetation following the landslide
2024 Pedersen Glacier Lagoon Landslide Flattened Vegetation

Flattened vegetation due to the tsunami caused by the 2024 Pedersen Glacier lagoon landslide in Alaska.

Photo of landslide source area with mountains and glacier in the background
2024 Pedersen Glacier Lagoon Landslide Source

Photo looking towards the landslide source, with debris from the subsequent tsunami in the foreground.

Photo of geologist holding survey equipment with mountains in the background
2024 Pedersen Glacier Lagoon Landslide Tsunami Damage Surveying

Geologist conducts a survey of the tsunami damage following the 2024 Pedersen Glacier lagoon landslide in Alaska.

Close up photo of a landslide in mountainous area with a glacier in the background
2024 Pedersen Glacier Lagoon Landslide Source Area and Runout

Landslide source area and upper portion of the landslide runout. The upper reaches of the landslide source material of the 2024 Pedersen Glacier lagoon landslide in Alaska.

Up close view of the lower zone of the landslide with the glacier in the bottom left corner
2024 Pedersen Glacier Lagoon Landslide Runout

Lower portion of the landslide runout along the Pedersen Glacier from the 2024 Pedersen Glacier lagoon landslide in Alaska.

Photo of marshy land area showing tsunami impact
2024 Pedersen Glacier Lagoon Landslide Tsunami Damage

Tsunami damage between the upper and lower portions of the lagoon from the landslide-generated tsunami from the 2024 Pedersen Glacier lagoon landslide in Alaska.  It moved toward the east at the western shore and uplands of the landform between the lagoons. 

Tsunami damage between the upper and lower portions of the lagoon from the landslide-generated tsunami from the 2024 Pedersen Glacier lagoon landslide in Alaska.  It moved toward the east at the western shore and uplands of the landform between the lagoons. 

Gif showing before and after aerial imagery of Pedersen Lagoon Landslide
2024 Pedersen Glacier Lagoon Landslide Before/After Imagery Gif

Animation of satellite images from August 4th and August 9th, 2024, showing the extent of vegetation damage due to the August 7th landslide-generated tsunami. Imagery © 2024 Planet Labs PBC.

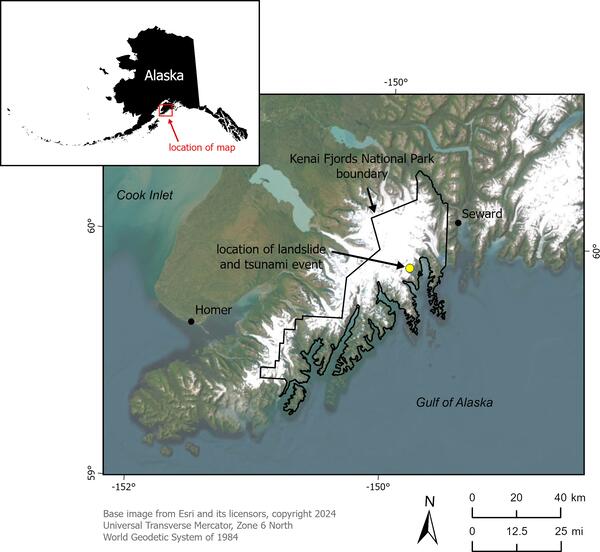
Map showing the location within Alaska of the Pedersen Lagoon Landslide and NPS boundary
2024 Pedersen Glacier Lagoon Landslide Overview Map

Overview map and location of the landslide-generated tsunami event within Alaska (inset) and Kenai Fjords National Park. 

Three seismic signals (up-down, north-south, east-west) with the landslide and seiche signals marked
2024 Pedersen Glacier Lagoon Landslide Seismic Signals

Seismic signals from the August 7th, 2024 tsunamigenic landslide recorded on seismic station AK.SWD, located approximately 30 km (approx. 18.6 mi) from the landslide location. Three directions of ground motion are shown. The gray line is the high-frequency filtered signal.

Seismic signals from the August 7th, 2024 tsunamigenic landslide recorded on seismic station AK.SWD, located approximately 30 km (approx. 18.6 mi) from the landslide location. Three directions of ground motion are shown. The gray line is the high-frequency filtered signal.

Three scientists next to completed landslide monitoring station
Yabucoa, Puerto Rico Landslide Monitoring Station

USGS scientists Bill Schulz and Mason Einbund collaborate with University of Puerto Rico-Mayagüez professor Stephen Hughes at Yabucoa, Puerto Rico landslide monitoring station.

USGS scientists Bill Schulz and Mason Einbund collaborate with University of Puerto Rico-Mayagüez professor Stephen Hughes at Yabucoa, Puerto Rico landslide monitoring station.

GIF of timelapse showing the tsunami impact of the Pedersen Glacier lagoon landslide
2024 Pedersen Glacier Lagoon Landslide Sentinel 2 NIR Time-Lapse GIF

Animation of Sentinel-2 near-infrared (NIR) satellite images from July 19th, July 27th, and August 9th, 2024, showing August 7th landslide-generated tsunami effects. Increase in dark/black areas on the land on August 9th shows the extent of changes to the surface and vegetation from the tsunami.  

Animation of Sentinel-2 near-infrared (NIR) satellite images from July 19th, July 27th, and August 9th, 2024, showing August 7th landslide-generated tsunami effects. Increase in dark/black areas on the land on August 9th shows the extent of changes to the surface and vegetation from the tsunami.  

Map marking the landslide initiation point, landslide travel path to water, and tsunami runup estimates
2024 Pedersen Glacier Lagoon Landslide Location Map

Map of upper and lower Pedersen Glacier lagoon showing the location of landslide initiation (yellow circle), approximate travel path to water (black dotted line with arrow), and preliminary estimates of tsunami runup height on land above the tide level at the time of the event.

Map of upper and lower Pedersen Glacier lagoon showing the location of landslide initiation (yellow circle), approximate travel path to water (black dotted line with arrow), and preliminary estimates of tsunami runup height on land above the tide level at the time of the event.

Words "Landslide Basics" on green background next to an illustration of a landslide.
Landslide Basics Cover Photo

This is a cover photo for the Landslide Basics node with the title next to an illustration of a landslide.

This is a cover photo for the Landslide Basics node with the title next to an illustration of a landslide.

Was this page helpful?