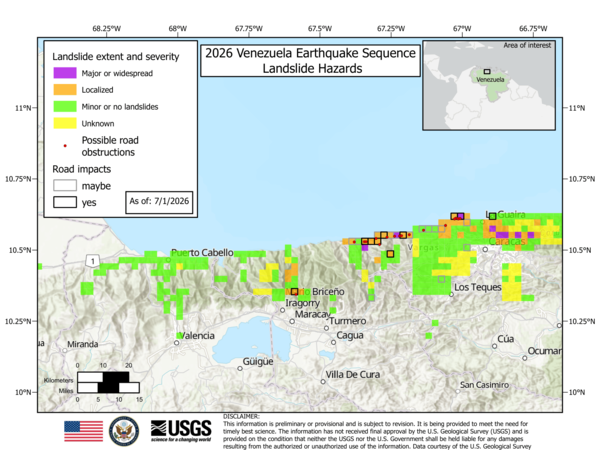
U.S. flag

An official website of the United States government

Images

Browse our photos of landslide research and post-landslide investigations.

Filter Total Items: 216
Map showing the earthquake epicenter and landslide probability and landslide points
2025 M7.0 Hubbard Glacier Earthquake-Triggered Landslides and Snow Avalanches Overview Map

Overview maps at the same scale showing the epicenter of the M7.0 Hubbard Glacier Earthquake and modeled peak ground acceleration contours. A) shows the probability of landslides triggered by the earthquake and mapped faults, and B) shows the locations of landslides mapped using synthetic aperture radar (SAR) change detection. 

Overview maps at the same scale showing the epicenter of the M7.0 Hubbard Glacier Earthquake and modeled peak ground acceleration contours. A) shows the probability of landslides triggered by the earthquake and mapped faults, and B) shows the locations of landslides mapped using synthetic aperture radar (SAR) change detection. 

GIF of radar backscatter satellite imagery showing the change in surface roughness before and after the earthquake
2025 M7.0 Hubbard Glacier Earthquake-Triggered Landslides and Snow Avalanches Satellite Imagery GIF

Animation of Sentinel-1 radar backscatter satellite imagery from November 28th and December 9th, 2025, showing the changes in surface roughness after the M7.0 Hubbard Glacier Earthquake. The lighter regions have rougher surface areas. The colored points correspond to preliminary mapping of potential mass movements.

Animation of Sentinel-1 radar backscatter satellite imagery from November 28th and December 9th, 2025, showing the changes in surface roughness after the M7.0 Hubbard Glacier Earthquake. The lighter regions have rougher surface areas. The colored points correspond to preliminary mapping of potential mass movements.

Landsat image showing landslide points in snowy mountains
2025 M7.0 Hubbard Glacier Earthquake-Triggered Landslides and Snow Avalanches Satellite Imagery

Landsat 9 true color, pan-sharpened satellite image collected on December 10, 2025, showing landslides triggered by the M7.0 Hubbard Glacier Earthquake on the slopes of Mount King George. Landslide points were mapped from SAR change detection.

Map showing the location of the tsunamigenic landslide in Tracy Arm southeast of Sawyer Island.
2025 Tracy Arm Landslide Overview Map

Overview map and location of the Tracy Arm landslide-generated tsunami event. The imagery is not current, and the South Sawyer Glacier has retreated over a kilometer from what is depicted. 

Overview map and location of the Tracy Arm landslide-generated tsunami event. The imagery is not current, and the South Sawyer Glacier has retreated over a kilometer from what is depicted. 

Aerial photo of landslide deposit at bottom of mountain and into the water
2025 Tracy Arm Landslide Aerial Photo Facing West

Oblique aerial photo of the August 10, 2025 landslide captured during a field reconnaissance overflight on August 13, 2025. Look direction is to the west.​

Photo of shoreline with debris showing tsunami-inundated area
2025 Tracy Arm Landslide Tsunami-Inundated Shoreline

Photo of tsunami-inundated shoreline at Williams Cove, near the mouth of Tracy Arm. Look direction is approximately north.​

Photo of mountainside with landslide headscarp
2025 Tracy Arm Landslide Headscarp

Oblique aerial photo of the August 10, 2025 landslide headscarp. Look direction is to the northwest.​

Before and after satellite imagery of the Tracy Arm landslide showing the toe of the South Sawyer Glacier missing after.
2025 Tracy Arm Landslide Before and After Satellite Imagery

Comparison of (a) pre- and (b) post-event satellite images showing the source area of the August 10th landslide that impacted Tracy Arm. The dashed line in (a) shows the approximate location of the front of South Sawyer Glacier on August 7th, 2025 (mapped from imagery © 2025 Planet Labs PBC).

Comparison of (a) pre- and (b) post-event satellite images showing the source area of the August 10th landslide that impacted Tracy Arm. The dashed line in (a) shows the approximate location of the front of South Sawyer Glacier on August 7th, 2025 (mapped from imagery © 2025 Planet Labs PBC).

Aerial photo of landslide taken across the fiord
2025 Tracy Arm Landslide Across the Fiord Facing North

Oblique aerial photo of the August 10, 2025 landslide taken from across the fiord during a field reconnaissance overflight on August 13, 2025. Look direction is approximately north.​

Aerial photo of mountainous landscape with landslide on the right hand side
2025 Tracy Arm Landslide Source Area Facing Northwest

Oblique aerial photo of the August 10, 2025 landslide, and tsunami trimline, captured during a field reconnaissance overflight on August 13, 2025. Look direction is to the northwest.​

Oblique aerial photo of the August 10, 2025 landslide, and tsunami trimline, captured during a field reconnaissance overflight on August 13, 2025. Look direction is to the northwest.​

Photo of mountainside with landslide in the center and glacier to the right
2025 Tracy Arm Landslide and South Sawyer Glacier Facing the Southeast

Oblique aerial photo of the August 10, 2025 landslide and South Sawyer Glacier captured during a field reconnaissance overflight on August 13, 2025. Look direction is to the southeast.​

Photo of a mountainous landscape with the landslide on the right
2025 Tracy Arm Landslide and Tsunami Trimline

Oblique aerial photo of the August 10, 2025 landslide source area captured during a field reconnaissance overflight on August 13, 2025. Look direction is approximately north.​

Oblique aerial photo of the August 10, 2025 landslide source area captured during a field reconnaissance overflight on August 13, 2025. Look direction is approximately north.​

Aerial photo of steep mountainside showing the landslide source area.
2025 Tracy Arm Landslide Source Area

Oblique aerial photo of the August 10, 2025 landslide source area captured during a field reconnaissance overflight on August 13, 2025. Look direction is approximately north.​

Oblique aerial photo of the August 10, 2025 landslide source area captured during a field reconnaissance overflight on August 13, 2025. Look direction is approximately north.​

Photo of island in water surrounded by mountains
Sawyer Island after 2025 Tracy Arm Landslide

Oblique aerial photo of Sawyer Island captured during a field reconnaissance overflight on August 13, 2025. Look direction is to the southeast.​

Photo looking towards a glacier on the left and a tsunami runup zone on the mountain on the right
2025 Tracy Arm Landslide Runup Zone and South Sawyer Glacier

Oblique aerial photo of the August 10, 2025 landslide across-fiord runup zone and South Sawyer Glacier captured during a field reconnaissance overflight on August 13, 2025. Look direction is to the southeast.​

Oblique aerial photo of the August 10, 2025 landslide across-fiord runup zone and South Sawyer Glacier captured during a field reconnaissance overflight on August 13, 2025. Look direction is to the southeast.​

person standing in canyon on top of mud, rocks, and vegetation
Debris flow in the 2025 Eaton Fire burn area, California

A postfire debris-flow deposit in Rubio Canyon, in the Eaton Fire burn area Los Angeles, County, California. Debris flows were triggered by intense rain on the recently burned hillslopes.  Mud- to boulder-sized sediment was deposited by the debris flow in this image. The flow also damaged trees near and within the channel where the flow traveled.  

A postfire debris-flow deposit in Rubio Canyon, in the Eaton Fire burn area Los Angeles, County, California. Debris flows were triggered by intense rain on the recently burned hillslopes.  Mud- to boulder-sized sediment was deposited by the debris flow in this image. The flow also damaged trees near and within the channel where the flow traveled.  

postfire debris flow science infographic
Postfire Debris Flow Science Infographic

POSTFIRE DEBRIS FLOW SCIENCE

The U.S. Geological Survey helps local, state, and federal agencies assess debris flow hazards in recently burned areas. We provide information about the likelihood of debris flow activity, where they might happen, and how big they might be.


DEBRIS FLOW ASSESSMENTS

POSTFIRE DEBRIS FLOW SCIENCE

The U.S. Geological Survey helps local, state, and federal agencies assess debris flow hazards in recently burned areas. We provide information about the likelihood of debris flow activity, where they might happen, and how big they might be.


DEBRIS FLOW ASSESSMENTS

hillslope partially covered by burned vegetation
Burned and unburned hillslopes, Eaton Fire, California

The boundary between burned and unburned terrain in the area burned by the 2025 Eaton Fire, Angeles National Forest, California.  Fire has removed all of the vegetation in the area of the hillslope visible in the image foreground.

The boundary between burned and unburned terrain in the area burned by the 2025 Eaton Fire, Angeles National Forest, California.  Fire has removed all of the vegetation in the area of the hillslope visible in the image foreground.

burned hillside with no ash and very sparse vegetation
A steep, burned hillside in the 2025 Eaton Fire, Los Angeles County, California.

A steep, burned hillside in the 2025 Eaton Fire, Los Angeles County, California.  The hillside is located near the northwestern edge of the burn perimeter, just off of Sunset Ridge road.  High winds while the fire burned and after it was contained has removed ash from the hillside.  

A steep, burned hillside in the 2025 Eaton Fire, Los Angeles County, California.  The hillside is located near the northwestern edge of the burn perimeter, just off of Sunset Ridge road.  High winds while the fire burned and after it was contained has removed ash from the hillside.  

Was this page helpful?