
Williston, North Dakota, sits very close to the center of the Williston Basin, which is a leading domestic oil- and gas-producing region. Williston also sits atop the Bakken Formation, a vast deposit of shale deep in the ground within the Williston Basin.
Images
Peruse our selection of remote sensing and Earth science imagery below.
Filter Total Items: 871
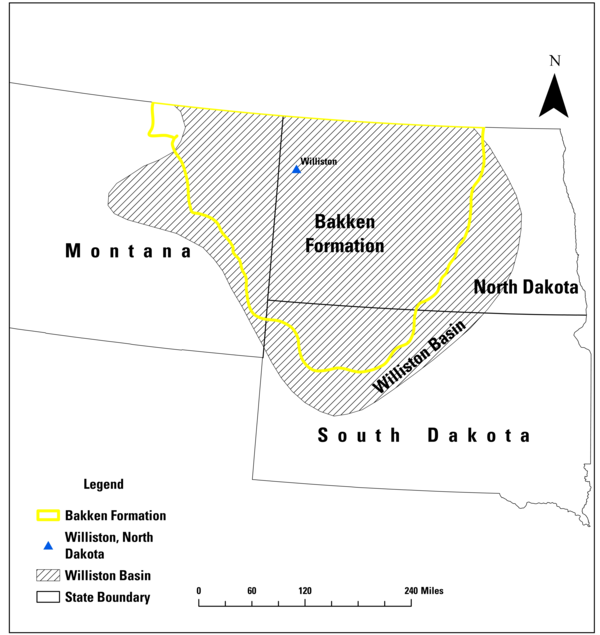
Map of the Bakken Formation and Williston Basin
Williston, North Dakota, sits very close to the center of the Williston Basin, which is a leading domestic oil- and gas-producing region. Williston also sits atop the Bakken Formation, a vast deposit of shale deep in the ground within the Williston Basin.
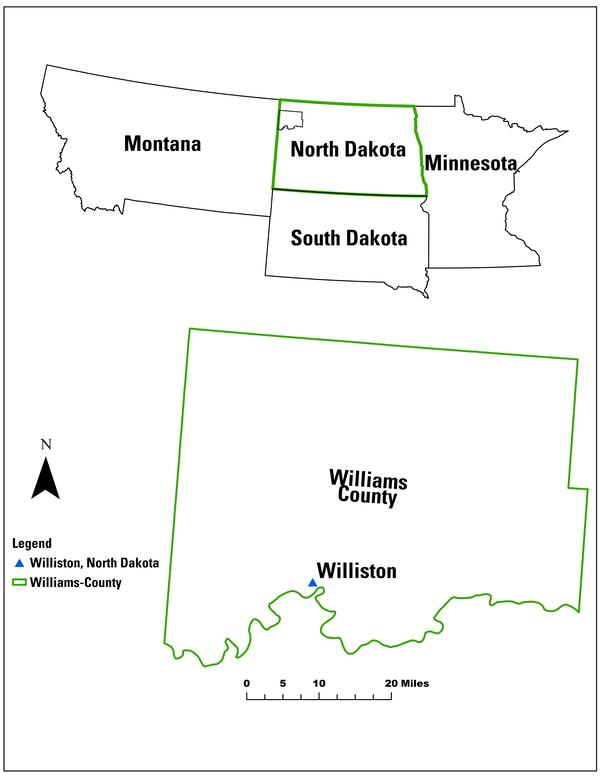
Williston, North Dakota, locator map
Williston, North Dakota, is located just north of the Missouri River in Williams County (northwestern North Dakota). Locator map by USGS Earth Resources Observation and Science (EROS) Center.
Williston, North Dakota, is located just north of the Missouri River in Williams County (northwestern North Dakota). Locator map by USGS Earth Resources Observation and Science (EROS) Center.
Annual NLCD Products and Landsat Images for the Williston, ND, area
Annual NLCD Products and Landsat Images for the Williston, ND, areaThese three animations, including Land Cover (left), Landsat (center) and Fractional Impervious Surface (right), show the changes on the ground in the Williston, North Dakota, area over time between 1984 and 2024.
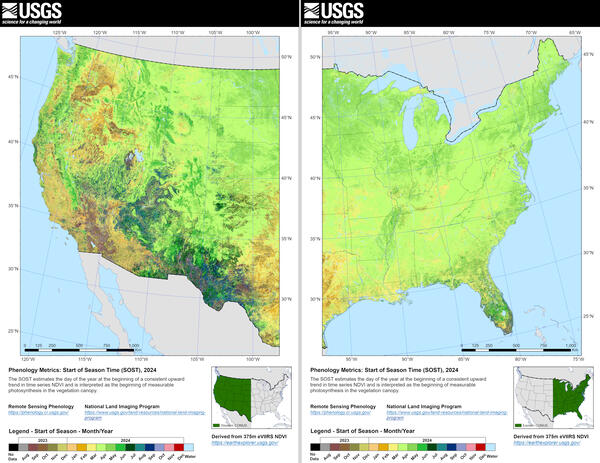
Western and Eastern region eVIIRS Remote Sensing Phenology Start of Season for 2024
Western and Eastern region eVIIRS Remote Sensing Phenology Start of Season for 2024Western and Eastern region eVIIRS Remote Sensing Phenology Start of Season (SOST) for 2024.
Western and Eastern region eVIIRS Remote Sensing Phenology Start of Season for 2024
Western and Eastern region eVIIRS Remote Sensing Phenology Start of Season for 2024Western and Eastern region eVIIRS Remote Sensing Phenology Start of Season (SOST) for 2024.
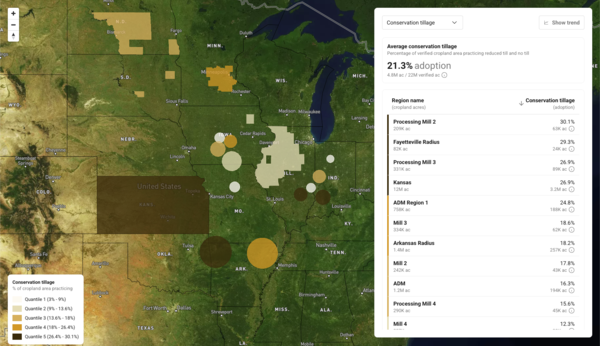
The prevalence of tillage conservation practices in select areas
The prevalence of tillage conservation practices in select areasThis Regrow Ag map gives an idea of the amount of acres of low-till or no-till practices in certain regions of the Midwest/Northern Plains. Map used with permission from Regrow Ag.

JACIE 2026 Workshop Save the Date
JACIE 2026 Workshop Save the Date
Visit the JACIE 2026 Workshop webpage to keep up with information about the April 2026 meeting.
JACIE 2026 Workshop Save the Date
Visit the JACIE 2026 Workshop webpage to keep up with information about the April 2026 meeting.

Annual NLCD and Landsat animations of the Boise, Idaho, area
Annual NLCD and Landsat animations of the Boise, Idaho, areaThis animation shows Treasure Valley, part of the Snake River Valley and home to the Boise, Idaho, metro area. The Boise Mountains lie to the east, and cropland and pasture/hay land lie to the west. The area’s population has seen significant growth in recent decades, far more than doubling between 1990 and now to above 800,000.
Animations (Annual NLCD and Landsat) of the 1992 Fountain Fire in California
Animations (Annual NLCD and Landsat) of the 1992 Fountain Fire in CaliforniaThis animation shows Annual NLCD land cover data on the left that was derived from Landsat imagery on the right. It illustrates the effects of the 1992 Fountain Fire in northern California and much of the forested area’s eventual recovery. The Fountain Fire burned about 64,000 acres, almost all of it privately owned.
Annual NLCD and Landsat animations of a portion of the Okefenokee Plain
Annual NLCD and Landsat animations of a portion of the Okefenokee PlainAnnual National Land Cover Database (NLCD) and Landsat animations of a portion of the Okefenokee Plain in Georgia.
Annual NLCD and Landsat animations of a portion of the Okefenokee Plain
Annual NLCD and Landsat animations of a portion of the Okefenokee PlainAnnual National Land Cover Database (NLCD) and Landsat animations of a portion of the Okefenokee Plain in Georgia.
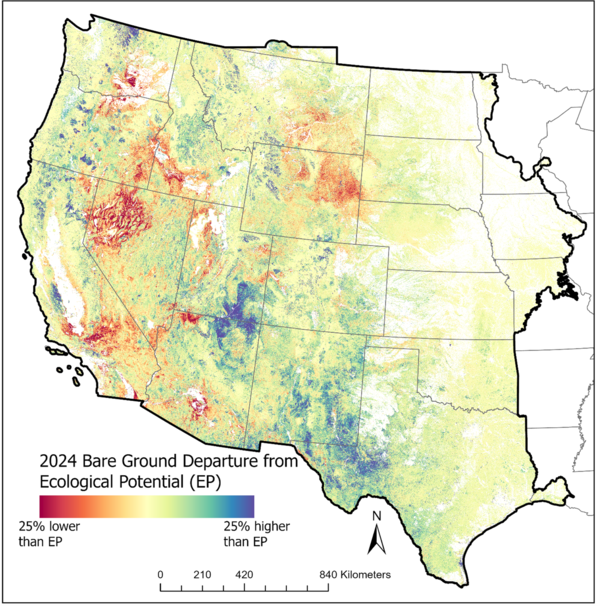
RCMAP 2024 Bare Ground Departure Ecological Potential image
RCMAP 2024 Bare Ground Departure Ecological Potential imageAn image of the Rangeland Condition Monitoring Assessment and Projection (RCMAP) 2024 Bare Ground Departure Ecological Potential (EP). Full 2024 EP dataset: https://www.mrlc.gov/rangeland-viewer/
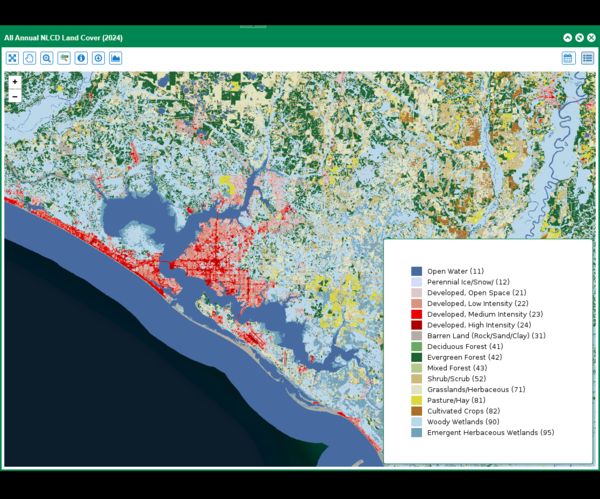
Annual NLCD land cover classification for 2024 for Bay County, Florida
Annual NLCD land cover classification for 2024 for Bay County, FloridaThis map shows the Annual National Land Cover Database (NLCD) land cover classifications for 2024 for Bay County, Florida. Annual NLCD is produced by the U.S. Geological Survey.
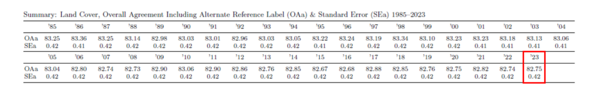
Overall Agreement for Collection 1.0 of Annual NLCD
Overall Agreement for Collection 1.0 of Annual NLCDOverall agreement (OAa) and standard error (SEa) (%) between Annual NLCD CU 1.0 at Anderson Level 1 land cover classes and primary (most likely) or alternate (but could be) land cover labels for CONUS, 1985-2023.
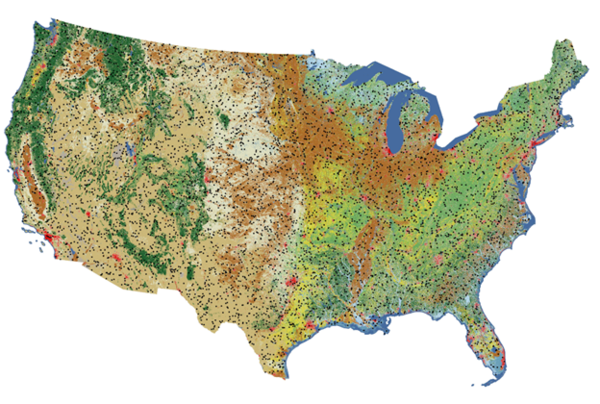
Reference And Validation Collection 1.0 sample plots
Reference And Validation Collection 1.0 sample plotsLocations of the 8,360 plots included in the reference dataset that were used in the accuracy assessment of Annual NLCD CU 1.0 (1985 – 2023). Each plot includes primary (most likely) and alternate (but could be) land cover type calls for 1984 – 2023.
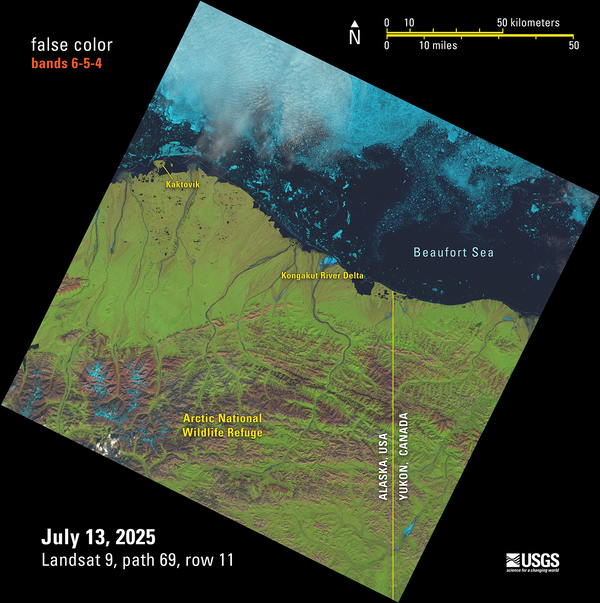
Landsat 9 False Color Image of the Beaufort Sea Shoreline
Landsat 9 False Color Image of the Beaufort Sea ShorelineThis Landsat 9 image showing the Beaufort Sea shoreline off of Alaska and Canada is just one of the scenes captured and processed on July 13, 2025— that day, the USGS EROS archive reached a milestone of one million Landsat 9 Level-1 products. This false color image was made with bands 6,5, and 4 from the Operational Land Imager.
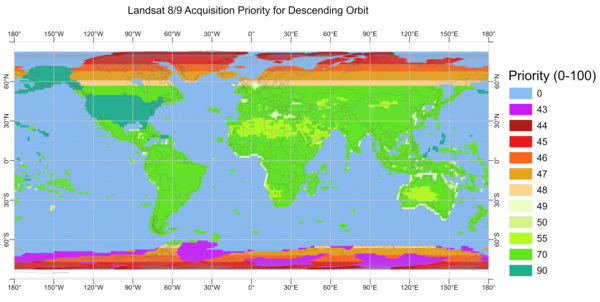
Landsat 8-9 Descending Acquisition Priority Map
This map displays the geographic coverage of descending (daytime) image acquisition priorities for Landsat 8 and Landsat 9 on a typical day. The priority scale denotes 0 (low priority) to 100 (high priority).
This map displays the geographic coverage of descending (daytime) image acquisition priorities for Landsat 8 and Landsat 9 on a typical day. The priority scale denotes 0 (low priority) to 100 (high priority).
Annual NLCD Linear Artifacts
Shows linear artifacts in Annual NLCD Land Cover product due to shrub and grass confusion.
Shows linear artifacts in Annual NLCD Land Cover product due to shrub and grass confusion.
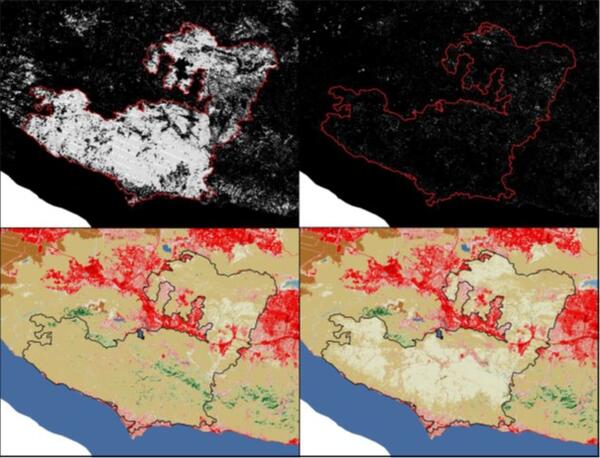
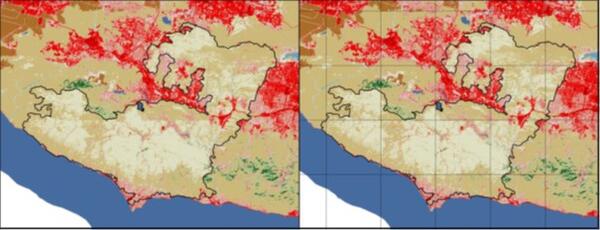
Woolsey Fire Four Images
The region of interest in the above images is Los Angeles and Ventura counties in California. The Woolsey fire started in 2018 on November 8th. The top left image shows the Annual NLCD spectral day change of year product where you can clearly see the Woolsey fire.
The region of interest in the above images is Los Angeles and Ventura counties in California. The Woolsey fire started in 2018 on November 8th. The top left image shows the Annual NLCD spectral day change of year product where you can clearly see the Woolsey fire.
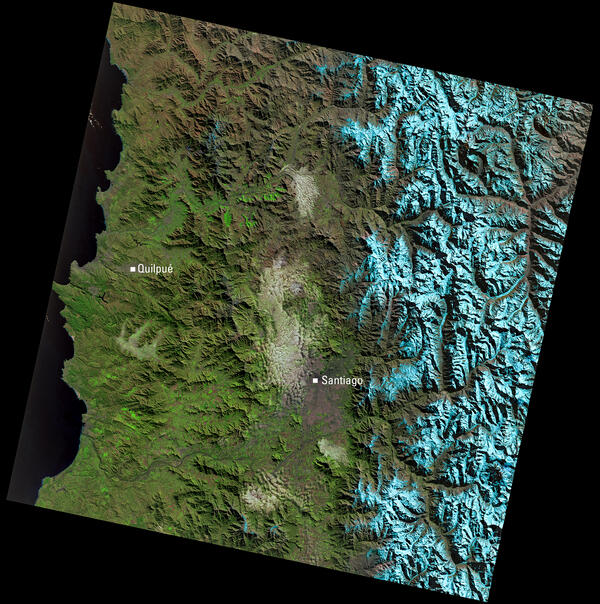
Landsat View of Central Chile and the Andes Mountains
Landsat View of Central Chile and the Andes MountainsThis Landsat 9 image of central Chile, acquired July 10, 2025, uses the shortwave infrared, near infrared, and red spectral bands ( bands 6,5,4) to highlight land cover. In this combination, healthy vegetation appears bright green, while snow and ice in the Andes Mountains show in bright blue.
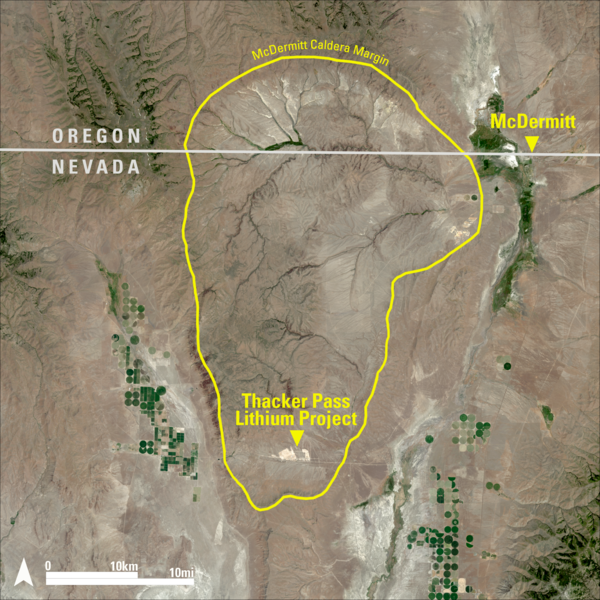
Landsat 8 Image of Thacker Pass
This Landsat 8 image highlights the McDermitt Caldera, which straddles the Nevada–Oregon border. The yellow boundary outlines the caldera margin, a geologic feature formed by a massive volcanic eruption millions of years ago. Over time, weathering of lithium-rich volcanic material led to the formation of clay deposits within the caldera basin.
This Landsat 8 image highlights the McDermitt Caldera, which straddles the Nevada–Oregon border. The yellow boundary outlines the caldera margin, a geologic feature formed by a massive volcanic eruption millions of years ago. Over time, weathering of lithium-rich volcanic material led to the formation of clay deposits within the caldera basin.
Annual NLCD animation of central Day County, South Dakota, from 1985 to 2023
Annual NLCD animation of central Day County, South Dakota, from 1985 to 2023An Annual National Land Cover Database (NLCD) animation of central Day County, South Dakota, from 1985 to 2023. Day County is in the Prairie Pothole Region. Annual NLCD is produced at the USGS Earth Resources Observation and Science (EROS) Center.
Annual NLCD animation of Devils Lake, North Dakota, from 1985 to 2023
Annual NLCD animation of Devils Lake, North Dakota, from 1985 to 2023An Annual National Land Cover Database (NLCD) animation of Devils Lake, North Dakota, from 1985 to 2023. Devils Lake is in the Prairie Pothole Region. Annual NLCD is produced at the USGS Earth Resources Observation and Science (EROS) Center.