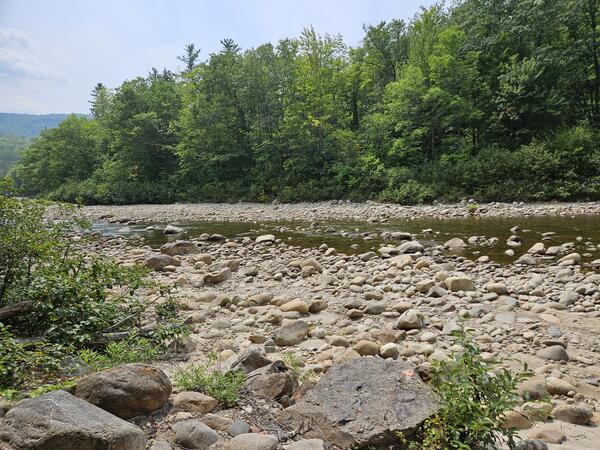
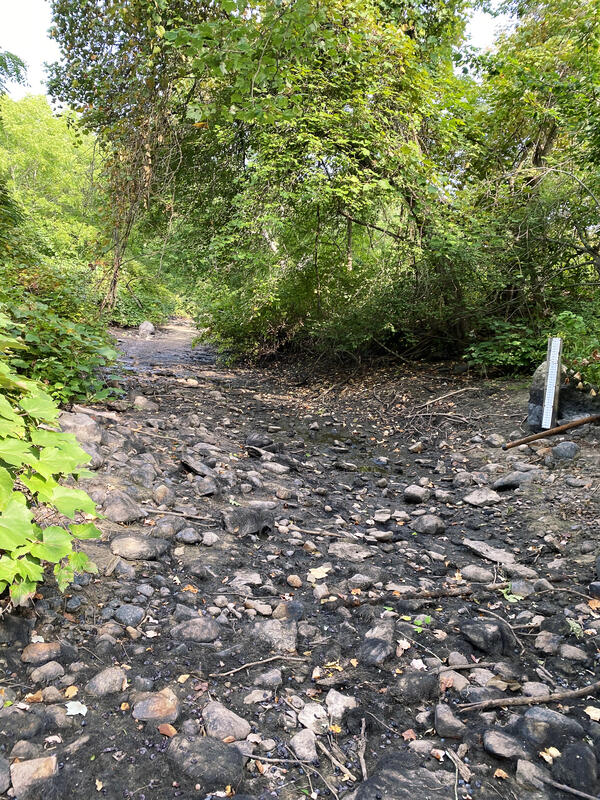


East Branch of the Pemigewasset River near Lincoln, New Hampshire, During a Drought
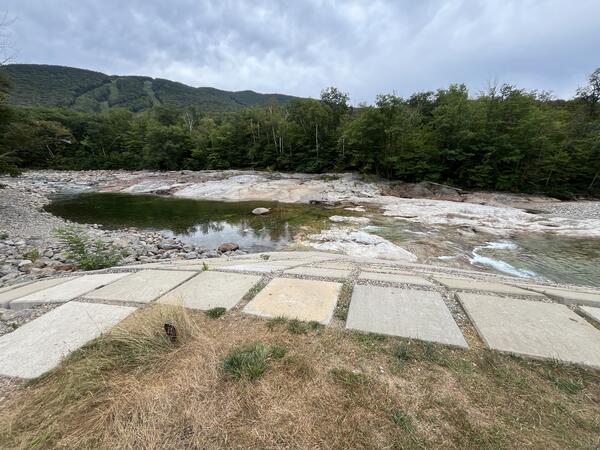
East Branch of the Pemigewasset River near Lincoln, New Hampshire, During a DroughtA view of the East Branch Pemigewasset River during a drought in the summer of 2025 near USGS monitoring station 01074520 near Lincoln, New Hampshire. Loon Mountain can be seen in the background.