
This is an animation showing the changing conditions of USGS streamgages from October 1, 2020 to September 30, 2021. The river conditions shown range from the driest condition seen at a gage (red open circles) to the wettest (blue closed circles). A purple outer ring around a gage indicates it is flooding.
Get the facts and figures about the USGS Streamgaging Network, one of the largest streamgaging enterprises in the world!
Media

Sources/Usage: Public Domain. View Media Details
All numbers below are for 2026.
National Streamgage Network
12,330 Streamgages
- Just over 9,100 monitor streamflow and water level year-round
- Over 3,200 only record water level or operate less than year-round
- Centennial Streamgages - have more than 100 years of records
- CY 2026 - 1,200
- CY 2025 - 1,060
Media

Sources/Usage: Public Domain. View Media Details
Federal Priority Streamgages
~7,330 (of 12,400 eligible FPS sites) active streamgages
- ~1,175 are fully funded by USGS FPS appropriations
- 5,070 eligible locations inactive due to lack of funding
Funding
Approximately \$230 million
- \$60 million from Federal appropriations
- Approximately \$170 million from nearly 1,500 partners
Water Data Delivery
In FY25, 2.06 billion of the 3.3 billion requests for USGS water information were for streamflow data
- Nearly 98% of requests fulfilled through web services
Media
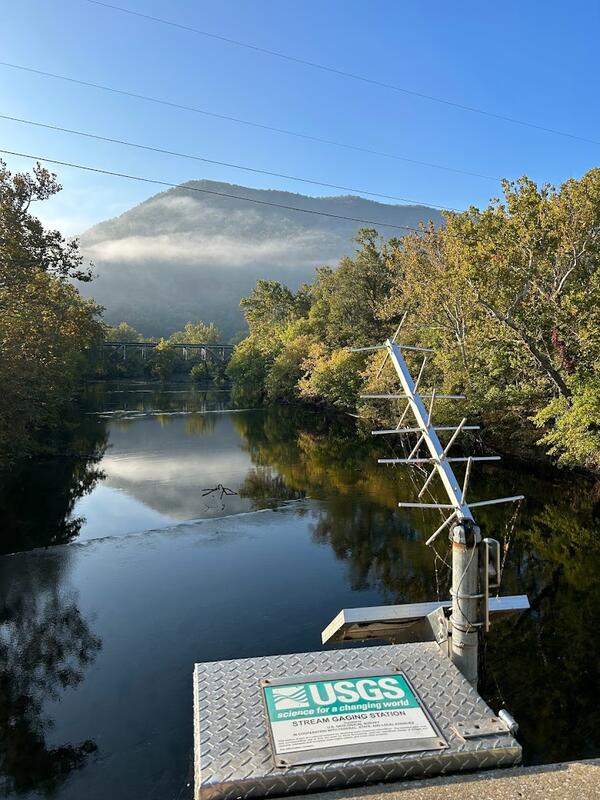
The USGS monitoring station 01634000 on the North Fork Shenandoah River near Strasburg.
Sources/Usage: Public Domain. View Media Details
Media
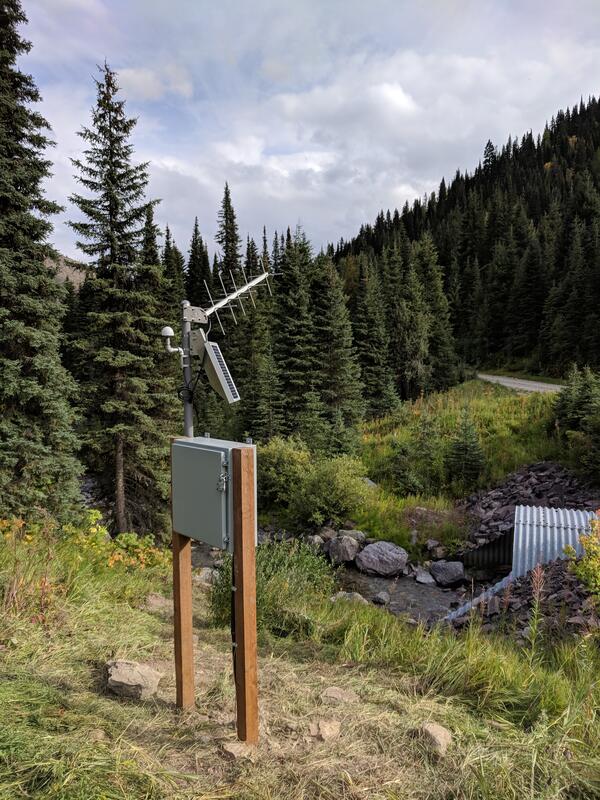
Hallowat Creek abv Kletomus Ck, nr Olney (12355342) streamgage
Sources/Usage: Public Domain. View Media Details
Below are other science projects associated with the USGS streamgaging network.

USGS National Streamgaging Network
As of October 2024, the USGS Groundwater and Streamflow Information Program supports the collection and (or) delivery of both streamflow and water-level information at 8,705 sites and water-level information alone at 3,460 additional sites. The data are served online—most in near real-time—to meet many diverse needs including the protection of life, property, the environment, and our economy.
Filter Total Items: 33

U.S. River Conditions, Water Year 2021
This is an animation showing the changing conditions of USGS streamgages from October 1, 2020 to September 30, 2021. The river conditions shown range from the driest condition seen at a gage (red open circles) to the wettest (blue closed circles). A purple outer ring around a gage indicates it is flooding.

U.S. River Conditions, July to September 2021
This is an animation showing the changing conditions of USGS streamgages from July 1, 2021 to September 30, 2021. The river conditions shown range from the driest condition seen at a gage (red open circles) to the wettest (blue closed circles). A purple outer ring around a gage indicates it is flooding.
This is an animation showing the changing conditions of USGS streamgages from July 1, 2021 to September 30, 2021. The river conditions shown range from the driest condition seen at a gage (red open circles) to the wettest (blue closed circles). A purple outer ring around a gage indicates it is flooding.

U.S. River Conditions, April to June 2021
This is an animation showing the changing conditions of USGS streamgages from April 1, 2021 to June 30, 2021. The river conditions shown range from the driest condition seen at a gage (red open circles) to the wettest (blue closed circles). A purple outer ring indicates it is flooding.
This is an animation showing the changing conditions of USGS streamgages from April 1, 2021 to June 30, 2021. The river conditions shown range from the driest condition seen at a gage (red open circles) to the wettest (blue closed circles). A purple outer ring indicates it is flooding.

U.S. River Conditions, January to March 2021
This is an animation showing the changing conditions of USGS streamgages from January 1, 2021 to March 31, 2021. The river conditions shown range from the driest condition seen at a gage (red open circles) to the wettest (blue closed circles). A purple outer ring around a gage indicates it is flooding.
This is an animation showing the changing conditions of USGS streamgages from January 1, 2021 to March 31, 2021. The river conditions shown range from the driest condition seen at a gage (red open circles) to the wettest (blue closed circles). A purple outer ring around a gage indicates it is flooding.

U.S. River Conditions, October to December 2020
This is an animation showing the changing conditions of USGS streamgages from October 1, 2020 to December 31, 2020. The river conditions shown range from the driest condition seen at a gage (red open circles) to the wettest (blue closed circles). A purple outer ring around a gage indicates it is flooding.
This is an animation showing the changing conditions of USGS streamgages from October 1, 2020 to December 31, 2020. The river conditions shown range from the driest condition seen at a gage (red open circles) to the wettest (blue closed circles). A purple outer ring around a gage indicates it is flooding.

U.S. River Conditions, Water Year 2020
This animation shows the changing conditions of USGS streamgages from October 1, 2019 to September 30, 2020. The conditions shown range from the driest condition seen at a gage (red open circles) to the wettest (blue closed circles). There is also a purple ring added to indicate gages that are flooding.
This animation shows the changing conditions of USGS streamgages from October 1, 2019 to September 30, 2020. The conditions shown range from the driest condition seen at a gage (red open circles) to the wettest (blue closed circles). There is also a purple ring added to indicate gages that are flooding.

U.S. River Conditions, July to September 2020
This is an animation showing the changing conditions of USGS streamgages from July 1, 2020 to September 30, 2020. The conditions shown range from the driest condition seen at a gage (red open circles) to the wettest (blue closed circles). There is also a purple ring added to indicate gages that are flooding.
This is an animation showing the changing conditions of USGS streamgages from July 1, 2020 to September 30, 2020. The conditions shown range from the driest condition seen at a gage (red open circles) to the wettest (blue closed circles). There is also a purple ring added to indicate gages that are flooding.

U.S. River Conditions, April to June 2020
This is an animation showing the changing conditions of USGS streamgages from April 1, 2020 to June 30, 2020. The conditions shown range from the driest condition seen at a gage (red open circles) to the wettest (blue closed circles). There is also a purple ring added to indicate gages that are flooding.
This is an animation showing the changing conditions of USGS streamgages from April 1, 2020 to June 30, 2020. The conditions shown range from the driest condition seen at a gage (red open circles) to the wettest (blue closed circles). There is also a purple ring added to indicate gages that are flooding.

U.S. River Conditions, January to March 2020
This is an animation showing the changing conditions of USGS streamgages from January 1, 2020 to March 31, 2020. The conditions shown range from the driest condition seen at a gage (red open circles) to the wettest (blue closed circles). There is also a purple ring added to indicate gages that are flooding.
This is an animation showing the changing conditions of USGS streamgages from January 1, 2020 to March 31, 2020. The conditions shown range from the driest condition seen at a gage (red open circles) to the wettest (blue closed circles). There is also a purple ring added to indicate gages that are flooding.
U.S. River Conditions From October to December 2019
U.S. River Conditions From October to December 2019This is an animation showing the changing conditions of USGS streamgages from October 1, 2019 to December 31, 2019. The conditions shown range from the driest condition seen at a gage (red open circles) to the wettest (blue closed circles). There is also a purple ring added to indicate gages that are flooding.

U.S. River Conditions From January to June 2019 Data Visualization
U.S. River Conditions From January to June 2019 Data VisualizationThis is an animation showing the changing conditions of USGS streamgages from January 1, 2019 to June 1, 2019. The conditions shown range from the driest condition seen at a gage (red open circles) to the wettest (blue closed circles). There is also a purple ring added to indicate gages that are flooding.

U.S. River Conditions for Water Year 2018
This is an animation showing the changing conditions of USGS streamgages for Water Year 2018 (October 1, 2017 to September 30, 2018). The conditions shown range from the driest condition seen at a gage to the wettest.
This is an animation showing the changing conditions of USGS streamgages for Water Year 2018 (October 1, 2017 to September 30, 2018). The conditions shown range from the driest condition seen at a gage to the wettest.
Get the facts and figures about the USGS Streamgaging Network, one of the largest streamgaging enterprises in the world!
Media
Sources/Usage: Public Domain. View Media Details
All numbers below are for 2026.
National Streamgage Network
12,330 Streamgages
- Just over 9,100 monitor streamflow and water level year-round
- Over 3,200 only record water level or operate less than year-round
- Centennial Streamgages - have more than 100 years of records
- CY 2026 - 1,200
- CY 2025 - 1,060
Media
Sources/Usage: Public Domain. View Media Details
Federal Priority Streamgages
~7,330 (of 12,400 eligible FPS sites) active streamgages
- ~1,175 are fully funded by USGS FPS appropriations
- 5,070 eligible locations inactive due to lack of funding
Funding
Approximately \$230 million
- \$60 million from Federal appropriations
- Approximately \$170 million from nearly 1,500 partners
Water Data Delivery
In FY25, 2.06 billion of the 3.3 billion requests for USGS water information were for streamflow data
- Nearly 98% of requests fulfilled through web services
Media
The USGS monitoring station 01634000 on the North Fork Shenandoah River near Strasburg.
Sources/Usage: Public Domain. View Media Details
Media
Hallowat Creek abv Kletomus Ck, nr Olney (12355342) streamgage
Sources/Usage: Public Domain. View Media Details
Below are other science projects associated with the USGS streamgaging network.
USGS National Streamgaging Network
As of October 2024, the USGS Groundwater and Streamflow Information Program supports the collection and (or) delivery of both streamflow and water-level information at 8,705 sites and water-level information alone at 3,460 additional sites. The data are served online—most in near real-time—to meet many diverse needs including the protection of life, property, the environment, and our economy.
Filter Total Items: 33
U.S. River Conditions, Water Year 2021
This is an animation showing the changing conditions of USGS streamgages from October 1, 2020 to September 30, 2021. The river conditions shown range from the driest condition seen at a gage (red open circles) to the wettest (blue closed circles). A purple outer ring around a gage indicates it is flooding.
This is an animation showing the changing conditions of USGS streamgages from October 1, 2020 to September 30, 2021. The river conditions shown range from the driest condition seen at a gage (red open circles) to the wettest (blue closed circles). A purple outer ring around a gage indicates it is flooding.
U.S. River Conditions, July to September 2021
This is an animation showing the changing conditions of USGS streamgages from July 1, 2021 to September 30, 2021. The river conditions shown range from the driest condition seen at a gage (red open circles) to the wettest (blue closed circles). A purple outer ring around a gage indicates it is flooding.
This is an animation showing the changing conditions of USGS streamgages from July 1, 2021 to September 30, 2021. The river conditions shown range from the driest condition seen at a gage (red open circles) to the wettest (blue closed circles). A purple outer ring around a gage indicates it is flooding.
U.S. River Conditions, April to June 2021
This is an animation showing the changing conditions of USGS streamgages from April 1, 2021 to June 30, 2021. The river conditions shown range from the driest condition seen at a gage (red open circles) to the wettest (blue closed circles). A purple outer ring indicates it is flooding.
This is an animation showing the changing conditions of USGS streamgages from April 1, 2021 to June 30, 2021. The river conditions shown range from the driest condition seen at a gage (red open circles) to the wettest (blue closed circles). A purple outer ring indicates it is flooding.
U.S. River Conditions, January to March 2021
This is an animation showing the changing conditions of USGS streamgages from January 1, 2021 to March 31, 2021. The river conditions shown range from the driest condition seen at a gage (red open circles) to the wettest (blue closed circles). A purple outer ring around a gage indicates it is flooding.
This is an animation showing the changing conditions of USGS streamgages from January 1, 2021 to March 31, 2021. The river conditions shown range from the driest condition seen at a gage (red open circles) to the wettest (blue closed circles). A purple outer ring around a gage indicates it is flooding.
U.S. River Conditions, October to December 2020
This is an animation showing the changing conditions of USGS streamgages from October 1, 2020 to December 31, 2020. The river conditions shown range from the driest condition seen at a gage (red open circles) to the wettest (blue closed circles). A purple outer ring around a gage indicates it is flooding.
This is an animation showing the changing conditions of USGS streamgages from October 1, 2020 to December 31, 2020. The river conditions shown range from the driest condition seen at a gage (red open circles) to the wettest (blue closed circles). A purple outer ring around a gage indicates it is flooding.
U.S. River Conditions, Water Year 2020
This animation shows the changing conditions of USGS streamgages from October 1, 2019 to September 30, 2020. The conditions shown range from the driest condition seen at a gage (red open circles) to the wettest (blue closed circles). There is also a purple ring added to indicate gages that are flooding.
This animation shows the changing conditions of USGS streamgages from October 1, 2019 to September 30, 2020. The conditions shown range from the driest condition seen at a gage (red open circles) to the wettest (blue closed circles). There is also a purple ring added to indicate gages that are flooding.
U.S. River Conditions, July to September 2020
This is an animation showing the changing conditions of USGS streamgages from July 1, 2020 to September 30, 2020. The conditions shown range from the driest condition seen at a gage (red open circles) to the wettest (blue closed circles). There is also a purple ring added to indicate gages that are flooding.
This is an animation showing the changing conditions of USGS streamgages from July 1, 2020 to September 30, 2020. The conditions shown range from the driest condition seen at a gage (red open circles) to the wettest (blue closed circles). There is also a purple ring added to indicate gages that are flooding.
U.S. River Conditions, April to June 2020
This is an animation showing the changing conditions of USGS streamgages from April 1, 2020 to June 30, 2020. The conditions shown range from the driest condition seen at a gage (red open circles) to the wettest (blue closed circles). There is also a purple ring added to indicate gages that are flooding.
This is an animation showing the changing conditions of USGS streamgages from April 1, 2020 to June 30, 2020. The conditions shown range from the driest condition seen at a gage (red open circles) to the wettest (blue closed circles). There is also a purple ring added to indicate gages that are flooding.
U.S. River Conditions, January to March 2020
This is an animation showing the changing conditions of USGS streamgages from January 1, 2020 to March 31, 2020. The conditions shown range from the driest condition seen at a gage (red open circles) to the wettest (blue closed circles). There is also a purple ring added to indicate gages that are flooding.
This is an animation showing the changing conditions of USGS streamgages from January 1, 2020 to March 31, 2020. The conditions shown range from the driest condition seen at a gage (red open circles) to the wettest (blue closed circles). There is also a purple ring added to indicate gages that are flooding.
U.S. River Conditions From October to December 2019
U.S. River Conditions From October to December 2019This is an animation showing the changing conditions of USGS streamgages from October 1, 2019 to December 31, 2019. The conditions shown range from the driest condition seen at a gage (red open circles) to the wettest (blue closed circles). There is also a purple ring added to indicate gages that are flooding.
U.S. River Conditions From October to December 2019
U.S. River Conditions From October to December 2019This is an animation showing the changing conditions of USGS streamgages from October 1, 2019 to December 31, 2019. The conditions shown range from the driest condition seen at a gage (red open circles) to the wettest (blue closed circles). There is also a purple ring added to indicate gages that are flooding.
U.S. River Conditions From January to June 2019 Data Visualization
U.S. River Conditions From January to June 2019 Data VisualizationThis is an animation showing the changing conditions of USGS streamgages from January 1, 2019 to June 1, 2019. The conditions shown range from the driest condition seen at a gage (red open circles) to the wettest (blue closed circles). There is also a purple ring added to indicate gages that are flooding.
U.S. River Conditions for Water Year 2018
This is an animation showing the changing conditions of USGS streamgages for Water Year 2018 (October 1, 2017 to September 30, 2018). The conditions shown range from the driest condition seen at a gage to the wettest.
This is an animation showing the changing conditions of USGS streamgages for Water Year 2018 (October 1, 2017 to September 30, 2018). The conditions shown range from the driest condition seen at a gage to the wettest.