
Marine Geohazards
Volcano Eruption - Hunga Tonga-Hunga Ha‘apai, Tonga
2022
Submarine Landslide - Resurrection Bay, Alaska
1964
Tsunami Damage - Natori, Japan
2011
Earthquake Damage - Fourth Avenue, Anchorage, Alaska
1964
Oil Spill - Deepwater Horizon, U.S. Gulf Coast
2016
Viscous Lava - Kīlauea, Hawai‘i
2018
Geologic activity in the ocean can cause dangerous or catastrophic events that threaten lives and critical infrastructure both at sea and on land. The USGS studies these geological events beneath the sea floor, known as marine geohazards, to provide decision makers with the information needed to mitigate risks to human communities, infrastructure, and the environment.
What are marine geohazards?
Marine geohazards, or ‘dangers in the deep’ include earthquakes, volcanic eruptions, submarine landslides, and tsunamis, as well as dissociation of gas hydrates—which can cause seafloor collapse—and oil spills or toxic seeps that affect deep sea life or change the physical characteristics of ocean environments.


Science to Address Hazards
Earthquakes, Landslides, and Tsunamis

Underwater earthquakes and landslides can generate tsunamis that cause hazards for coastal communities. USGS scientists study the subduction zone and the recent history of marine hazards and evaluate the future potential and probable impacts of such events on a regional basis. Quantifying these various hazards (e.g., earthquakes, landslides, tsunamis, and volcanoes) using geological and geophysical data, interpretations, and models improves understanding of the underlying processes of marine geohazards to assess the threats they pose. The USGS develops reliable deterministic and probabilistic estimates of the hazards that are used by engineers and policymakers to help reduce risk.
One barrier to measuring seismic risk has been the scarcity of high-resolution maps of the ocean floor. To fill these gaps, USGS scientists conduct high-resolution mapping offshore, especially near urban regions such as Southern California and the Pacific Northwest that are particularly at risk from seismic hazards. Creating three-dimensional views of the seafloor has given scientists remarkable ways to examine how a fault works, or how fluids may follow underground paths and potentially trigger submarine landslides. These landslides threaten offshore structures such as seafloor pipelines, cables, and equipment for oil and gas exploration. They can also trigger tsunamis that endanger coastal communities worldwide.
To discover a fault’s structure, scientists go to sea to collect streams of data that they turn into comprehensive underwater maps. This type of imaging, along with knowing the age of the sediment along faults and measuring other factors such as magnetics and density, can help tell the story of when the fault last ruptured or how fast it is moving. USGS incorporates these data, which have historically been challenging to collect, into earthquake models to estimate their actual hazard risk. Using high-resolution mapping and seismic technology to gather detailed seafloor data can directly impact human life and cities by improving earthquake and tsunami forecasts.
Research results are used in evaluations of earthquake risk zoning, public disaster education and preparedness, and engineering and building codes. Additionally, reassessing the threat of earthquake, tsunami, and landslide hazards to ports and nuclear power plants can directly impact facility management, emergency-management planning, and plant re-licensing.
The Atlantic and Gulf margins are heavily urbanized, support extensive port and industrial/resource facilities, and host 10 nuclear power plants. The USGS completed quantitative assessments of submarine landslides for the U.S. Atlantic coast from Maine to Florida and throughout the Gulf Region to better comprehend the risk of potential submarine landslides and tsunamis to these areas and associated infrastructure.


Gas Hydrates and Seafloor Collapse

Naturally occurring gas hydrates are ice-like combinations of water and (usually methane) gas that form in sediment below the sea floor and in areas of continuous permafrost when pressure and temperature conditions are appropriate.
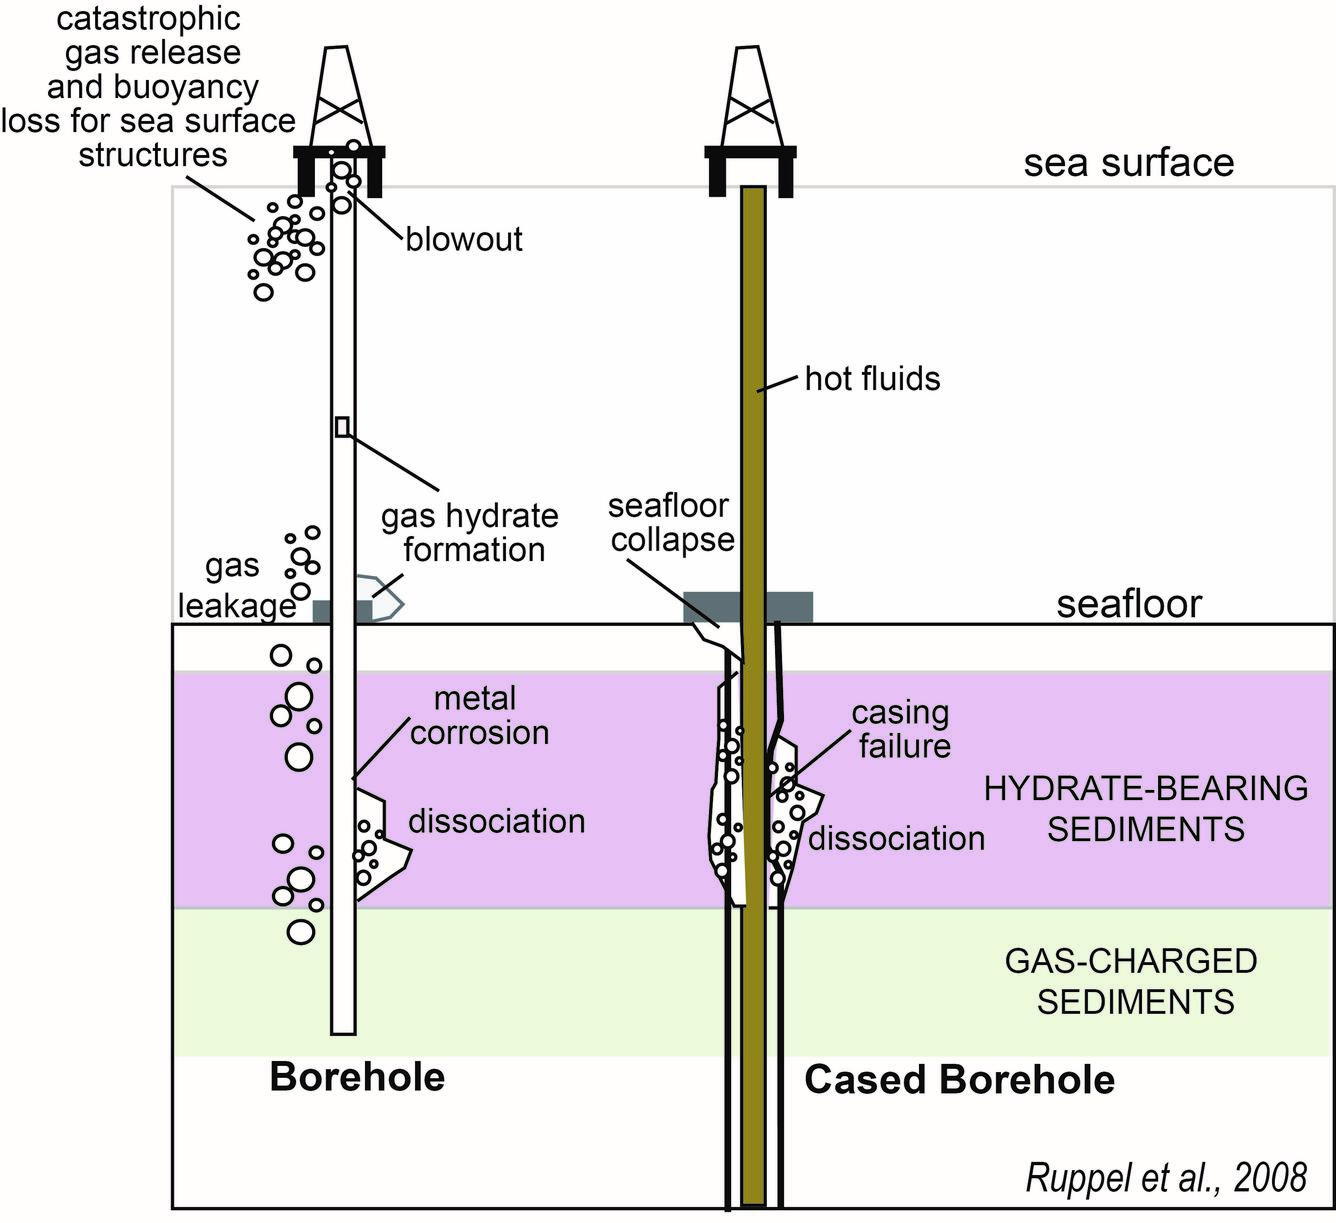
In deep water marine settings where warm fluids are pumped from great depths below the seafloor for extraction of conventional oil and gas, heating of sediments near a well could lead to breakdown of gas hydrates and release gas and water. Intact gas hydrates generally strengthen marine sediments, and dissociation of gas hydrates could lead to subsidence or collapse of the seafloor near the well. Features associated with natural failure of the seafloor (landslides) have also been linked to gas hydrates in some cases. USGS scientists support submarine geohazards research through field-based surveys that refine understanding of the hydrates-slope failure association and through geotechnical studies that evaluate the response of sediments to dissociation or dissolution of gas hydrates.
Science

Cascadia Subduction Zone Marine Geohazards

California Seafloor Mapping Program

Seafloor Faults off Southern California

Hazards: EXPRESS

Coastal and Marine Geohazards of the U.S. West Coast and Alaska
Multimedia


Science crew from the USGS Pacific Coastal and Marine Science Center work on deployment of seismic streamer on deck of R/V Robert Gordon Sproul. Green cable is the hydrophone streamer and a "bird" is being attached to control depth in the water.
Science crew from the USGS Pacific Coastal and Marine Science Center work on deployment of seismic streamer on deck of R/V Robert Gordon Sproul. Green cable is the hydrophone streamer and a "bird" is being attached to control depth in the water.

Looking across the back deck/stern of the R/V Robert Gordon Sproul. The wire going through the block in the A-frame leads to the CHIRP sonar fish towed in the water. Oil platforms are shown in the distance.
Looking across the back deck/stern of the R/V Robert Gordon Sproul. The wire going through the block in the A-frame leads to the CHIRP sonar fish towed in the water. Oil platforms are shown in the distance.

On December 26th, 2004, a massive 9.1 magnitude earthquake struck off the west coast of northern Sumatra, Indonesia. The third largest earthquake ever recorded lifted the sea floor several meters, causing tsunami waves to ripple out in all directions and race across the ocean. Banda Aceh bore the brunt of the waves just 15 to 20 minutes after the earthquake.
On December 26th, 2004, a massive 9.1 magnitude earthquake struck off the west coast of northern Sumatra, Indonesia. The third largest earthquake ever recorded lifted the sea floor several meters, causing tsunami waves to ripple out in all directions and race across the ocean. Banda Aceh bore the brunt of the waves just 15 to 20 minutes after the earthquake.

Dr. Nora Nieminski is a research geologist and Mendenhall Fellow at the USGS Pacific Coastal and Marine Science Center in Santa Cruz, California. She is pictured here, on board Marine Vessel Bold Horizon, with a piston core sample collected from the southern Cascadia subduction zone offshore of northern California/southern Oregon.
Dr. Nora Nieminski is a research geologist and Mendenhall Fellow at the USGS Pacific Coastal and Marine Science Center in Santa Cruz, California. She is pictured here, on board Marine Vessel Bold Horizon, with a piston core sample collected from the southern Cascadia subduction zone offshore of northern California/southern Oregon.

Jumbo piston corer

Multichannel seismic-reflection profile from Queen Charlotte-Fault
Multichannel seismic-reflection profile from Queen Charlotte-FaultMultichannel seismic-reflection profile across the Queen Charlotte-Fairweather fault, acquired aboard the R/V Norseman in August 2016. Dashed red line in enlarged section at lower right is the Queen Charlotte-Fairweather fault. m, meter; km, kilometer; ms, millisecond.

Researchers work on R/V Norseman amid thick fog on Resurrection Bay
Researchers work on R/V Norseman amid thick fog on Resurrection BayDan Ebuna (University of California, Santa Cruz; left) and Jackson Currie (USGS) work on the R/V Norseman amid thick fog on Resurrection Bay. They are preparing to test equipment that will image sediment layers beneath the seafloor.

Mary McGann (left, USGS) and Rachel Lauer (University of Calgary) sample pore fluids from sediment cores collected aboard the Canadian Coast Guard Ship John P.
Mary McGann (left, USGS) and Rachel Lauer (University of Calgary) sample pore fluids from sediment cores collected aboard the Canadian Coast Guard Ship John P.
Cascadia Subduction Zone Marine Geohazards
California Seafloor Mapping Program
Seafloor Faults off Southern California
Hazards: EXPRESS
Coastal and Marine Geohazards of the U.S. West Coast and Alaska

Tsunami Hazards, Modeling, and the Sedimentary Record

Tsunami and Earthquake Research

Large Oil Spills

U.S. Geological Survey Gas Hydrates Project

Caribbean Tsunami and Earthquake Hazards Studies

Tracking Oil Spills: Before, During, and Decades Later
Science crew from the USGS Pacific Coastal and Marine Science Center work on deployment of seismic streamer on deck of R/V Robert Gordon Sproul. Green cable is the hydrophone streamer and a "bird" is being attached to control depth in the water.
Science crew from the USGS Pacific Coastal and Marine Science Center work on deployment of seismic streamer on deck of R/V Robert Gordon Sproul. Green cable is the hydrophone streamer and a "bird" is being attached to control depth in the water.
Looking across the back deck/stern of the R/V Robert Gordon Sproul. The wire going through the block in the A-frame leads to the CHIRP sonar fish towed in the water. Oil platforms are shown in the distance.
Looking across the back deck/stern of the R/V Robert Gordon Sproul. The wire going through the block in the A-frame leads to the CHIRP sonar fish towed in the water. Oil platforms are shown in the distance.
On December 26th, 2004, a massive 9.1 magnitude earthquake struck off the west coast of northern Sumatra, Indonesia. The third largest earthquake ever recorded lifted the sea floor several meters, causing tsunami waves to ripple out in all directions and race across the ocean. Banda Aceh bore the brunt of the waves just 15 to 20 minutes after the earthquake.
On December 26th, 2004, a massive 9.1 magnitude earthquake struck off the west coast of northern Sumatra, Indonesia. The third largest earthquake ever recorded lifted the sea floor several meters, causing tsunami waves to ripple out in all directions and race across the ocean. Banda Aceh bore the brunt of the waves just 15 to 20 minutes after the earthquake.
Dr. Nora Nieminski is a research geologist and Mendenhall Fellow at the USGS Pacific Coastal and Marine Science Center in Santa Cruz, California. She is pictured here, on board Marine Vessel Bold Horizon, with a piston core sample collected from the southern Cascadia subduction zone offshore of northern California/southern Oregon.
Dr. Nora Nieminski is a research geologist and Mendenhall Fellow at the USGS Pacific Coastal and Marine Science Center in Santa Cruz, California. She is pictured here, on board Marine Vessel Bold Horizon, with a piston core sample collected from the southern Cascadia subduction zone offshore of northern California/southern Oregon.
Jumbo piston corer
Multichannel seismic-reflection profile from Queen Charlotte-Fault
Multichannel seismic-reflection profile from Queen Charlotte-FaultMultichannel seismic-reflection profile across the Queen Charlotte-Fairweather fault, acquired aboard the R/V Norseman in August 2016. Dashed red line in enlarged section at lower right is the Queen Charlotte-Fairweather fault. m, meter; km, kilometer; ms, millisecond.
Researchers work on R/V Norseman amid thick fog on Resurrection Bay
Researchers work on R/V Norseman amid thick fog on Resurrection BayDan Ebuna (University of California, Santa Cruz; left) and Jackson Currie (USGS) work on the R/V Norseman amid thick fog on Resurrection Bay. They are preparing to test equipment that will image sediment layers beneath the seafloor.
Mary McGann (left, USGS) and Rachel Lauer (University of Calgary) sample pore fluids from sediment cores collected aboard the Canadian Coast Guard Ship John P.
Mary McGann (left, USGS) and Rachel Lauer (University of Calgary) sample pore fluids from sediment cores collected aboard the Canadian Coast Guard Ship John P.

Multichannel seismic-reflection profile, Sitka Sound
Multichannel seismic-reflection profile, Sitka SoundMultichannel seismic-reflection profile showing deformed and offset sediment layers below the outer continental shelf west of Sitka. The Sitka Sound fault is one of more than a dozen previously unmapped faults discovered in the July 2017 seismic-reflection data.

University of Washington's research vessel R/V Barnes is loaded with the USGS multichannel seismic system components GeoEel, Chirp, and boom plates.
University of Washington's research vessel R/V Barnes is loaded with the USGS multichannel seismic system components GeoEel, Chirp, and boom plates.

Seafloor offshore of Point Estero (PE) showing east (EH) and west (WH) strands of the Hosgri fault zone. Arrow points to a seafloor slope (a 12,000 year old shoreline) that has been offset by the east Hosgri strand, indicating a slip rate of about 2.6 millimeters per year.
Seafloor offshore of Point Estero (PE) showing east (EH) and west (WH) strands of the Hosgri fault zone. Arrow points to a seafloor slope (a 12,000 year old shoreline) that has been offset by the east Hosgri strand, indicating a slip rate of about 2.6 millimeters per year.

Jumbo Piston Corer Takes Cores Up to 20 Meters Long
Jumbo Piston Corer Takes Cores Up to 20 Meters LongThis piston corer recovers as much as 20 meters of sediment from below the seafloor, which is used to reconstruct the history of the Arctic Ocean and its sea ice.
Jumbo Piston Corer Takes Cores Up to 20 Meters Long
Jumbo Piston Corer Takes Cores Up to 20 Meters LongThis piston corer recovers as much as 20 meters of sediment from below the seafloor, which is used to reconstruct the history of the Arctic Ocean and its sea ice.

The airgun sled is painted orange and suspended from the A-frame. The three airguns are suspended beneath the sled. The multichannel digital streamer (yellow cable going into the water from the sled) is towed from the the weighted sled to keep it under the ice. This photo shows the number of crew required to safely deploy the airgun sled.
The airgun sled is painted orange and suspended from the A-frame. The three airguns are suspended beneath the sled. The multichannel digital streamer (yellow cable going into the water from the sled) is towed from the the weighted sled to keep it under the ice. This photo shows the number of crew required to safely deploy the airgun sled.

Bathymetry of the northeast corner of the Caribbean plate
Bathymetry of the northeast corner of the Caribbean plateBathymetry of the northeast corner of the Caribbean plate
Bathymetry of the northeast corner of the Caribbean plate
Bathymetry of the northeast corner of the Caribbean plateBathymetry of the northeast corner of the Caribbean plate

Helicopter view Canadian Coast Guard Ship Louis S. St. Laurent (left) and U.S. Coast Guard Cutter Healy (right) on the Arctic Ocean. You can see the bubbler system working on Louis. The ships are coming together because the crews are planning to meet and learn the operations of the other ship. This was during a scientific expedition to map the Arctic seafloor.
Helicopter view Canadian Coast Guard Ship Louis S. St. Laurent (left) and U.S. Coast Guard Cutter Healy (right) on the Arctic Ocean. You can see the bubbler system working on Louis. The ships are coming together because the crews are planning to meet and learn the operations of the other ship. This was during a scientific expedition to map the Arctic seafloor.

Helicopter view of Canadian Coast Guard Ship Louis S. St. Laurent (left) and U.S. Coast Guard Cutter Healy (right) on the Arctic Ocean. The ships are coming together because the crews are planning to meet and learn the operations of the other ship. This was during a scientific expedition to map the Arctic seafloor.
Helicopter view of Canadian Coast Guard Ship Louis S. St. Laurent (left) and U.S. Coast Guard Cutter Healy (right) on the Arctic Ocean. The ships are coming together because the crews are planning to meet and learn the operations of the other ship. This was during a scientific expedition to map the Arctic seafloor.

Helicopter view of Canadian Coast Guard Ship Louis S. St. Laurent (top) and U.S. Coast Guard Cutter Healy (bottom) on the Arctic Ocean. This was during a scientific expedition to map the extended continental shelf in the Arctic Ocean.
Helicopter view of Canadian Coast Guard Ship Louis S. St. Laurent (top) and U.S. Coast Guard Cutter Healy (bottom) on the Arctic Ocean. This was during a scientific expedition to map the extended continental shelf in the Arctic Ocean.

Tsunami waves caused by 2004 Sumatra-Andaman earthquake
Tsunami waves caused by 2004 Sumatra-Andaman earthquakeTsunami waves, view to the northwest
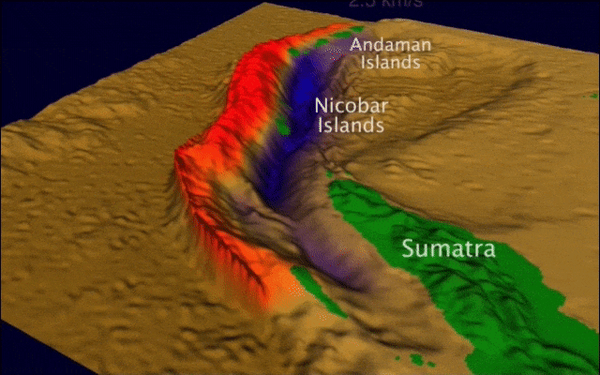
Vertical movement of seafloor, 2004 Sumatra-Andaman earthquake
Vertical movement of seafloor, 2004 Sumatra-Andaman earthquakeVertical movement of the seafloor over the 2004 Sumatra-Andaman earthquake, view to the northwest, water removed
Vertical movement of seafloor, 2004 Sumatra-Andaman earthquake
Vertical movement of seafloor, 2004 Sumatra-Andaman earthquakeVertical movement of the seafloor over the 2004 Sumatra-Andaman earthquake, view to the northwest, water removed

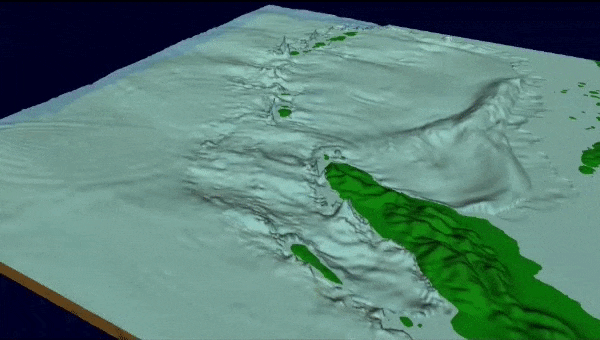
Sonar-generated image showing underwater topography and the potential for landslides near the head of Resurrection Bay, Alaska. The terrain looks three times as steep as it occurs naturally. The arrow points to underwater landslide debris from the collapse of a fan-delta following the great Alaskan earthquake of 1964.
Sonar-generated image showing underwater topography and the potential for landslides near the head of Resurrection Bay, Alaska. The terrain looks three times as steep as it occurs naturally. The arrow points to underwater landslide debris from the collapse of a fan-delta following the great Alaskan earthquake of 1964.

What is marine geology? What is marine geology?
Geology is the study of the Earth. This includes how the Earth was formed, how the Earth has changed since it was formed, the materials that make up the Earth, and the processes that act on it. Marine Geology focuses on areas affected by our oceans including the deep ocean floor, the shallower slopes and shelves that surround the continents, and coastal areas like beaches and estuaries. USGS...

Will California eventually fall into the ocean? Will California eventually fall into the ocean?
No, California is not going to fall into the ocean. California is firmly planted on the top of the earth’s crust in a location where it spans two tectonic plates. The San Andreas Fault System, which crosses California from the Salton Sea in the south to Cape Mendocino in the north, is the boundary between the Pacific Plate (that includes the Pacific Ocean) and North American Plate (that includes...

What is the difference between a tsunami and a tidal wave? What is the difference between a tsunami and a tidal wave?
Although both are sea waves, a tsunami and a tidal wave are two different and unrelated phenomena. A tidal wave is a shallow water wave caused by the gravitational interactions between the Sun, Moon, and Earth ("tidal wave" was used in earlier times to describe what we now call a tsunami.) A tsunami is an ocean wave triggered by large earthquakes that occur near or under the ocean, volcanic...

What are tsunamis? What are tsunamis?
Tsunamis are ocean waves triggered by: Large earthquakes that occur near or under the ocean Volcanic eruptions Submarine landslides Onshore landslides in which large volumes of debris fall into the water Scientists do not use the term "tidal wave" because these waves are not caused by tides. Tsunami waves are unlike typical ocean waves generated by wind and storms, and most tsunamis do not "break"...
What is it about an earthquake that causes a tsunami? What is it about an earthquake that causes a tsunami?
Although earthquake magnitude is one factor that affects tsunami generation, there are other important factors to consider. The earthquake must be a shallow marine event that displaces the seafloor. Thrust earthquakes (as opposed to strike slip) are far more likely to generate tsunamis, but small tsunamis have occurred in a few cases from large (i.e., > M8) strike-slip earthquakes. Note the...

Is there a system to warn populations of an imminent occurrence of a tsunami? Is there a system to warn populations of an imminent occurrence of a tsunami?
NOAA (National Oceanic and Atmospheric Administration) maintains the U.S. Tsunami Warning Centers, and work in conjunction with USGS seismic networks to help determine when and where to issue tsunami warnings. Also, if an earthquake meets certain criteria for potentially generating a tsunami, the pop-up window and the event page for that earthquake on the USGS Latest Earthquakes Map will include a...

What is "vog"? How is it related to sulfur dioxide (SO2) emissions? What is "vog"? How is it related to sulfur dioxide (SO2) emissions?
Vog (volcanic smog) is a visible haze comprised of gas and an aerosol of tiny particles and acidic droplets created when sulfur dioxide (SO 2) and other gases emitted from a volcano chemically interact with sunlight and atmospheric oxygen, moisture, and dust. Volcanic gas emissions can pose environmental and health risks to nearby communities. Vog is a hazard that's associated with Hawaiian...

What is the "Ring of Fire"? What is the "Ring of Fire"?
Most earthquakes and volcanic eruptions do not strike randomly but occur in specific areas, such as along plate boundaries. One such area is the circum-Pacific Ring of Fire, where the Pacific Plate meets many surrounding tectonic plates. The Ring of Fire is the most seismically and volcanically active zone in the world. Learn more: USGS Volcano Hazards Program
Geologic activity in the ocean can cause dangerous or catastrophic events that threaten lives and critical infrastructure both at sea and on land. The USGS studies these geological events beneath the sea floor, known as marine geohazards, to provide decision makers with the information needed to mitigate risks to human communities, infrastructure, and the environment.
What are marine geohazards?
Marine geohazards, or ‘dangers in the deep’ include earthquakes, volcanic eruptions, submarine landslides, and tsunamis, as well as dissociation of gas hydrates—which can cause seafloor collapse—and oil spills or toxic seeps that affect deep sea life or change the physical characteristics of ocean environments.
Science to Address Hazards
Earthquakes, Landslides, and Tsunamis
Underwater earthquakes and landslides can generate tsunamis that cause hazards for coastal communities. USGS scientists study the subduction zone and the recent history of marine hazards and evaluate the future potential and probable impacts of such events on a regional basis. Quantifying these various hazards (e.g., earthquakes, landslides, tsunamis, and volcanoes) using geological and geophysical data, interpretations, and models improves understanding of the underlying processes of marine geohazards to assess the threats they pose. The USGS develops reliable deterministic and probabilistic estimates of the hazards that are used by engineers and policymakers to help reduce risk.
One barrier to measuring seismic risk has been the scarcity of high-resolution maps of the ocean floor. To fill these gaps, USGS scientists conduct high-resolution mapping offshore, especially near urban regions such as Southern California and the Pacific Northwest that are particularly at risk from seismic hazards. Creating three-dimensional views of the seafloor has given scientists remarkable ways to examine how a fault works, or how fluids may follow underground paths and potentially trigger submarine landslides. These landslides threaten offshore structures such as seafloor pipelines, cables, and equipment for oil and gas exploration. They can also trigger tsunamis that endanger coastal communities worldwide.
To discover a fault’s structure, scientists go to sea to collect streams of data that they turn into comprehensive underwater maps. This type of imaging, along with knowing the age of the sediment along faults and measuring other factors such as magnetics and density, can help tell the story of when the fault last ruptured or how fast it is moving. USGS incorporates these data, which have historically been challenging to collect, into earthquake models to estimate their actual hazard risk. Using high-resolution mapping and seismic technology to gather detailed seafloor data can directly impact human life and cities by improving earthquake and tsunami forecasts.
Research results are used in evaluations of earthquake risk zoning, public disaster education and preparedness, and engineering and building codes. Additionally, reassessing the threat of earthquake, tsunami, and landslide hazards to ports and nuclear power plants can directly impact facility management, emergency-management planning, and plant re-licensing.
The Atlantic and Gulf margins are heavily urbanized, support extensive port and industrial/resource facilities, and host 10 nuclear power plants. The USGS completed quantitative assessments of submarine landslides for the U.S. Atlantic coast from Maine to Florida and throughout the Gulf Region to better comprehend the risk of potential submarine landslides and tsunamis to these areas and associated infrastructure.
Gas Hydrates and Seafloor Collapse
Naturally occurring gas hydrates are ice-like combinations of water and (usually methane) gas that form in sediment below the sea floor and in areas of continuous permafrost when pressure and temperature conditions are appropriate.
In deep water marine settings where warm fluids are pumped from great depths below the seafloor for extraction of conventional oil and gas, heating of sediments near a well could lead to breakdown of gas hydrates and release gas and water. Intact gas hydrates generally strengthen marine sediments, and dissociation of gas hydrates could lead to subsidence or collapse of the seafloor near the well. Features associated with natural failure of the seafloor (landslides) have also been linked to gas hydrates in some cases. USGS scientists support submarine geohazards research through field-based surveys that refine understanding of the hydrates-slope failure association and through geotechnical studies that evaluate the response of sediments to dissociation or dissolution of gas hydrates.
Science
Cascadia Subduction Zone Marine Geohazards
California Seafloor Mapping Program
Seafloor Faults off Southern California
Hazards: EXPRESS
Coastal and Marine Geohazards of the U.S. West Coast and Alaska
Multimedia
Science crew from the USGS Pacific Coastal and Marine Science Center work on deployment of seismic streamer on deck of R/V Robert Gordon Sproul. Green cable is the hydrophone streamer and a "bird" is being attached to control depth in the water.
Science crew from the USGS Pacific Coastal and Marine Science Center work on deployment of seismic streamer on deck of R/V Robert Gordon Sproul. Green cable is the hydrophone streamer and a "bird" is being attached to control depth in the water.
Looking across the back deck/stern of the R/V Robert Gordon Sproul. The wire going through the block in the A-frame leads to the CHIRP sonar fish towed in the water. Oil platforms are shown in the distance.
Looking across the back deck/stern of the R/V Robert Gordon Sproul. The wire going through the block in the A-frame leads to the CHIRP sonar fish towed in the water. Oil platforms are shown in the distance.
On December 26th, 2004, a massive 9.1 magnitude earthquake struck off the west coast of northern Sumatra, Indonesia. The third largest earthquake ever recorded lifted the sea floor several meters, causing tsunami waves to ripple out in all directions and race across the ocean. Banda Aceh bore the brunt of the waves just 15 to 20 minutes after the earthquake.
On December 26th, 2004, a massive 9.1 magnitude earthquake struck off the west coast of northern Sumatra, Indonesia. The third largest earthquake ever recorded lifted the sea floor several meters, causing tsunami waves to ripple out in all directions and race across the ocean. Banda Aceh bore the brunt of the waves just 15 to 20 minutes after the earthquake.
Dr. Nora Nieminski is a research geologist and Mendenhall Fellow at the USGS Pacific Coastal and Marine Science Center in Santa Cruz, California. She is pictured here, on board Marine Vessel Bold Horizon, with a piston core sample collected from the southern Cascadia subduction zone offshore of northern California/southern Oregon.
Dr. Nora Nieminski is a research geologist and Mendenhall Fellow at the USGS Pacific Coastal and Marine Science Center in Santa Cruz, California. She is pictured here, on board Marine Vessel Bold Horizon, with a piston core sample collected from the southern Cascadia subduction zone offshore of northern California/southern Oregon.
Jumbo piston corer
Multichannel seismic-reflection profile from Queen Charlotte-Fault
Multichannel seismic-reflection profile from Queen Charlotte-FaultMultichannel seismic-reflection profile across the Queen Charlotte-Fairweather fault, acquired aboard the R/V Norseman in August 2016. Dashed red line in enlarged section at lower right is the Queen Charlotte-Fairweather fault. m, meter; km, kilometer; ms, millisecond.
Multichannel seismic-reflection profile from Queen Charlotte-Fault
Multichannel seismic-reflection profile from Queen Charlotte-FaultMultichannel seismic-reflection profile across the Queen Charlotte-Fairweather fault, acquired aboard the R/V Norseman in August 2016. Dashed red line in enlarged section at lower right is the Queen Charlotte-Fairweather fault. m, meter; km, kilometer; ms, millisecond.
Researchers work on R/V Norseman amid thick fog on Resurrection Bay
Researchers work on R/V Norseman amid thick fog on Resurrection BayDan Ebuna (University of California, Santa Cruz; left) and Jackson Currie (USGS) work on the R/V Norseman amid thick fog on Resurrection Bay. They are preparing to test equipment that will image sediment layers beneath the seafloor.
Researchers work on R/V Norseman amid thick fog on Resurrection Bay
Researchers work on R/V Norseman amid thick fog on Resurrection BayDan Ebuna (University of California, Santa Cruz; left) and Jackson Currie (USGS) work on the R/V Norseman amid thick fog on Resurrection Bay. They are preparing to test equipment that will image sediment layers beneath the seafloor.
Mary McGann (left, USGS) and Rachel Lauer (University of Calgary) sample pore fluids from sediment cores collected aboard the Canadian Coast Guard Ship John P.
Mary McGann (left, USGS) and Rachel Lauer (University of Calgary) sample pore fluids from sediment cores collected aboard the Canadian Coast Guard Ship John P.
Cascadia Subduction Zone Marine Geohazards
California Seafloor Mapping Program
Seafloor Faults off Southern California
Hazards: EXPRESS
Coastal and Marine Geohazards of the U.S. West Coast and Alaska
Tsunami Hazards, Modeling, and the Sedimentary Record
Tsunami and Earthquake Research
Large Oil Spills
U.S. Geological Survey Gas Hydrates Project
Caribbean Tsunami and Earthquake Hazards Studies
Tracking Oil Spills: Before, During, and Decades Later
Science crew from the USGS Pacific Coastal and Marine Science Center work on deployment of seismic streamer on deck of R/V Robert Gordon Sproul. Green cable is the hydrophone streamer and a "bird" is being attached to control depth in the water.
Science crew from the USGS Pacific Coastal and Marine Science Center work on deployment of seismic streamer on deck of R/V Robert Gordon Sproul. Green cable is the hydrophone streamer and a "bird" is being attached to control depth in the water.
Looking across the back deck/stern of the R/V Robert Gordon Sproul. The wire going through the block in the A-frame leads to the CHIRP sonar fish towed in the water. Oil platforms are shown in the distance.
Looking across the back deck/stern of the R/V Robert Gordon Sproul. The wire going through the block in the A-frame leads to the CHIRP sonar fish towed in the water. Oil platforms are shown in the distance.
On December 26th, 2004, a massive 9.1 magnitude earthquake struck off the west coast of northern Sumatra, Indonesia. The third largest earthquake ever recorded lifted the sea floor several meters, causing tsunami waves to ripple out in all directions and race across the ocean. Banda Aceh bore the brunt of the waves just 15 to 20 minutes after the earthquake.
On December 26th, 2004, a massive 9.1 magnitude earthquake struck off the west coast of northern Sumatra, Indonesia. The third largest earthquake ever recorded lifted the sea floor several meters, causing tsunami waves to ripple out in all directions and race across the ocean. Banda Aceh bore the brunt of the waves just 15 to 20 minutes after the earthquake.
Dr. Nora Nieminski is a research geologist and Mendenhall Fellow at the USGS Pacific Coastal and Marine Science Center in Santa Cruz, California. She is pictured here, on board Marine Vessel Bold Horizon, with a piston core sample collected from the southern Cascadia subduction zone offshore of northern California/southern Oregon.
Dr. Nora Nieminski is a research geologist and Mendenhall Fellow at the USGS Pacific Coastal and Marine Science Center in Santa Cruz, California. She is pictured here, on board Marine Vessel Bold Horizon, with a piston core sample collected from the southern Cascadia subduction zone offshore of northern California/southern Oregon.
Jumbo piston corer
Multichannel seismic-reflection profile from Queen Charlotte-Fault
Multichannel seismic-reflection profile from Queen Charlotte-FaultMultichannel seismic-reflection profile across the Queen Charlotte-Fairweather fault, acquired aboard the R/V Norseman in August 2016. Dashed red line in enlarged section at lower right is the Queen Charlotte-Fairweather fault. m, meter; km, kilometer; ms, millisecond.
Multichannel seismic-reflection profile from Queen Charlotte-Fault
Multichannel seismic-reflection profile from Queen Charlotte-FaultMultichannel seismic-reflection profile across the Queen Charlotte-Fairweather fault, acquired aboard the R/V Norseman in August 2016. Dashed red line in enlarged section at lower right is the Queen Charlotte-Fairweather fault. m, meter; km, kilometer; ms, millisecond.
Researchers work on R/V Norseman amid thick fog on Resurrection Bay
Researchers work on R/V Norseman amid thick fog on Resurrection BayDan Ebuna (University of California, Santa Cruz; left) and Jackson Currie (USGS) work on the R/V Norseman amid thick fog on Resurrection Bay. They are preparing to test equipment that will image sediment layers beneath the seafloor.
Researchers work on R/V Norseman amid thick fog on Resurrection Bay
Researchers work on R/V Norseman amid thick fog on Resurrection BayDan Ebuna (University of California, Santa Cruz; left) and Jackson Currie (USGS) work on the R/V Norseman amid thick fog on Resurrection Bay. They are preparing to test equipment that will image sediment layers beneath the seafloor.
Mary McGann (left, USGS) and Rachel Lauer (University of Calgary) sample pore fluids from sediment cores collected aboard the Canadian Coast Guard Ship John P.
Mary McGann (left, USGS) and Rachel Lauer (University of Calgary) sample pore fluids from sediment cores collected aboard the Canadian Coast Guard Ship John P.
Multichannel seismic-reflection profile, Sitka Sound
Multichannel seismic-reflection profile, Sitka SoundMultichannel seismic-reflection profile showing deformed and offset sediment layers below the outer continental shelf west of Sitka. The Sitka Sound fault is one of more than a dozen previously unmapped faults discovered in the July 2017 seismic-reflection data.
University of Washington's research vessel R/V Barnes is loaded with the USGS multichannel seismic system components GeoEel, Chirp, and boom plates.
University of Washington's research vessel R/V Barnes is loaded with the USGS multichannel seismic system components GeoEel, Chirp, and boom plates.
Seafloor offshore of Point Estero (PE) showing east (EH) and west (WH) strands of the Hosgri fault zone. Arrow points to a seafloor slope (a 12,000 year old shoreline) that has been offset by the east Hosgri strand, indicating a slip rate of about 2.6 millimeters per year.
Seafloor offshore of Point Estero (PE) showing east (EH) and west (WH) strands of the Hosgri fault zone. Arrow points to a seafloor slope (a 12,000 year old shoreline) that has been offset by the east Hosgri strand, indicating a slip rate of about 2.6 millimeters per year.
Jumbo Piston Corer Takes Cores Up to 20 Meters Long
Jumbo Piston Corer Takes Cores Up to 20 Meters LongThis piston corer recovers as much as 20 meters of sediment from below the seafloor, which is used to reconstruct the history of the Arctic Ocean and its sea ice.
Jumbo Piston Corer Takes Cores Up to 20 Meters Long
Jumbo Piston Corer Takes Cores Up to 20 Meters LongThis piston corer recovers as much as 20 meters of sediment from below the seafloor, which is used to reconstruct the history of the Arctic Ocean and its sea ice.
The airgun sled is painted orange and suspended from the A-frame. The three airguns are suspended beneath the sled. The multichannel digital streamer (yellow cable going into the water from the sled) is towed from the the weighted sled to keep it under the ice. This photo shows the number of crew required to safely deploy the airgun sled.
The airgun sled is painted orange and suspended from the A-frame. The three airguns are suspended beneath the sled. The multichannel digital streamer (yellow cable going into the water from the sled) is towed from the the weighted sled to keep it under the ice. This photo shows the number of crew required to safely deploy the airgun sled.
Bathymetry of the northeast corner of the Caribbean plate
Bathymetry of the northeast corner of the Caribbean plateBathymetry of the northeast corner of the Caribbean plate
Bathymetry of the northeast corner of the Caribbean plate
Bathymetry of the northeast corner of the Caribbean plateBathymetry of the northeast corner of the Caribbean plate
Helicopter view Canadian Coast Guard Ship Louis S. St. Laurent (left) and U.S. Coast Guard Cutter Healy (right) on the Arctic Ocean. You can see the bubbler system working on Louis. The ships are coming together because the crews are planning to meet and learn the operations of the other ship. This was during a scientific expedition to map the Arctic seafloor.
Helicopter view Canadian Coast Guard Ship Louis S. St. Laurent (left) and U.S. Coast Guard Cutter Healy (right) on the Arctic Ocean. You can see the bubbler system working on Louis. The ships are coming together because the crews are planning to meet and learn the operations of the other ship. This was during a scientific expedition to map the Arctic seafloor.
Helicopter view of Canadian Coast Guard Ship Louis S. St. Laurent (left) and U.S. Coast Guard Cutter Healy (right) on the Arctic Ocean. The ships are coming together because the crews are planning to meet and learn the operations of the other ship. This was during a scientific expedition to map the Arctic seafloor.
Helicopter view of Canadian Coast Guard Ship Louis S. St. Laurent (left) and U.S. Coast Guard Cutter Healy (right) on the Arctic Ocean. The ships are coming together because the crews are planning to meet and learn the operations of the other ship. This was during a scientific expedition to map the Arctic seafloor.
Helicopter view of Canadian Coast Guard Ship Louis S. St. Laurent (top) and U.S. Coast Guard Cutter Healy (bottom) on the Arctic Ocean. This was during a scientific expedition to map the extended continental shelf in the Arctic Ocean.
Helicopter view of Canadian Coast Guard Ship Louis S. St. Laurent (top) and U.S. Coast Guard Cutter Healy (bottom) on the Arctic Ocean. This was during a scientific expedition to map the extended continental shelf in the Arctic Ocean.
Tsunami waves caused by 2004 Sumatra-Andaman earthquake
Tsunami waves caused by 2004 Sumatra-Andaman earthquakeTsunami waves, view to the northwest
Vertical movement of seafloor, 2004 Sumatra-Andaman earthquake
Vertical movement of seafloor, 2004 Sumatra-Andaman earthquakeVertical movement of the seafloor over the 2004 Sumatra-Andaman earthquake, view to the northwest, water removed
Vertical movement of seafloor, 2004 Sumatra-Andaman earthquake
Vertical movement of seafloor, 2004 Sumatra-Andaman earthquakeVertical movement of the seafloor over the 2004 Sumatra-Andaman earthquake, view to the northwest, water removed
Sonar-generated image showing underwater topography and the potential for landslides near the head of Resurrection Bay, Alaska. The terrain looks three times as steep as it occurs naturally. The arrow points to underwater landslide debris from the collapse of a fan-delta following the great Alaskan earthquake of 1964.
Sonar-generated image showing underwater topography and the potential for landslides near the head of Resurrection Bay, Alaska. The terrain looks three times as steep as it occurs naturally. The arrow points to underwater landslide debris from the collapse of a fan-delta following the great Alaskan earthquake of 1964.
What is marine geology? What is marine geology?
Geology is the study of the Earth. This includes how the Earth was formed, how the Earth has changed since it was formed, the materials that make up the Earth, and the processes that act on it. Marine Geology focuses on areas affected by our oceans including the deep ocean floor, the shallower slopes and shelves that surround the continents, and coastal areas like beaches and estuaries. USGS...
Will California eventually fall into the ocean? Will California eventually fall into the ocean?
No, California is not going to fall into the ocean. California is firmly planted on the top of the earth’s crust in a location where it spans two tectonic plates. The San Andreas Fault System, which crosses California from the Salton Sea in the south to Cape Mendocino in the north, is the boundary between the Pacific Plate (that includes the Pacific Ocean) and North American Plate (that includes...
What is the difference between a tsunami and a tidal wave? What is the difference between a tsunami and a tidal wave?
Although both are sea waves, a tsunami and a tidal wave are two different and unrelated phenomena. A tidal wave is a shallow water wave caused by the gravitational interactions between the Sun, Moon, and Earth ("tidal wave" was used in earlier times to describe what we now call a tsunami.) A tsunami is an ocean wave triggered by large earthquakes that occur near or under the ocean, volcanic...
What are tsunamis? What are tsunamis?
Tsunamis are ocean waves triggered by: Large earthquakes that occur near or under the ocean Volcanic eruptions Submarine landslides Onshore landslides in which large volumes of debris fall into the water Scientists do not use the term "tidal wave" because these waves are not caused by tides. Tsunami waves are unlike typical ocean waves generated by wind and storms, and most tsunamis do not "break"...
What is it about an earthquake that causes a tsunami? What is it about an earthquake that causes a tsunami?
Although earthquake magnitude is one factor that affects tsunami generation, there are other important factors to consider. The earthquake must be a shallow marine event that displaces the seafloor. Thrust earthquakes (as opposed to strike slip) are far more likely to generate tsunamis, but small tsunamis have occurred in a few cases from large (i.e., > M8) strike-slip earthquakes. Note the...
Is there a system to warn populations of an imminent occurrence of a tsunami? Is there a system to warn populations of an imminent occurrence of a tsunami?
NOAA (National Oceanic and Atmospheric Administration) maintains the U.S. Tsunami Warning Centers, and work in conjunction with USGS seismic networks to help determine when and where to issue tsunami warnings. Also, if an earthquake meets certain criteria for potentially generating a tsunami, the pop-up window and the event page for that earthquake on the USGS Latest Earthquakes Map will include a...
What is "vog"? How is it related to sulfur dioxide (SO2) emissions? What is "vog"? How is it related to sulfur dioxide (SO2) emissions?
Vog (volcanic smog) is a visible haze comprised of gas and an aerosol of tiny particles and acidic droplets created when sulfur dioxide (SO 2) and other gases emitted from a volcano chemically interact with sunlight and atmospheric oxygen, moisture, and dust. Volcanic gas emissions can pose environmental and health risks to nearby communities. Vog is a hazard that's associated with Hawaiian...
What is the "Ring of Fire"? What is the "Ring of Fire"?
Most earthquakes and volcanic eruptions do not strike randomly but occur in specific areas, such as along plate boundaries. One such area is the circum-Pacific Ring of Fire, where the Pacific Plate meets many surrounding tectonic plates. The Ring of Fire is the most seismically and volcanically active zone in the world. Learn more: USGS Volcano Hazards Program