
Landsat 8’s first image captured the area where the Great Plains and Rocky Mountains meet in Colorado. The natural-color image shows the coniferous forest of the mountains coming down to the dormant plains. Boulder, Colorado, sits in the middle of the image.
Images
Explore the images on this page to learn more about the Landsat sensors, satellites and missions.
Filter Total Items: 413

Boulder, Colorado (2023)
Landsat 8’s first image captured the area where the Great Plains and Rocky Mountains meet in Colorado. The natural-color image shows the coniferous forest of the mountains coming down to the dormant plains. Boulder, Colorado, sits in the middle of the image.

Landsat 9 Captures Mauna Loa and Kilauea Eruption
Rare spotting! Dueling volcanoes captured by Landsat 9 satellite. Mauna Loa's 11.3-mile-long lava flow illuminates the plume of ash in the atmosphere above. The small red spot in the lower right is Kilauea—it began erupting nine days ago. USGS Volcanoes says a dual eruption has not occurred in Hawaii since 1984, making this a rare event.
Rare spotting! Dueling volcanoes captured by Landsat 9 satellite. Mauna Loa's 11.3-mile-long lava flow illuminates the plume of ash in the atmosphere above. The small red spot in the lower right is Kilauea—it began erupting nine days ago. USGS Volcanoes says a dual eruption has not occurred in Hawaii since 1984, making this a rare event.

Three Landsats in Space
For the first time in Landsat history, a trio of imaging satellites (Landsat 7, Landsat 8, and Landsat 9) have been recording thousands of images of the planet weekly. The trio has been working together since October 2021.
Learn more about the Landsat Program at www.usgs.gov/landsat
For the first time in Landsat history, a trio of imaging satellites (Landsat 7, Landsat 8, and Landsat 9) have been recording thousands of images of the planet weekly. The trio has been working together since October 2021.
Learn more about the Landsat Program at www.usgs.gov/landsat

Charlotte and Monroe, North Carolina
In 2022, President Joe Biden pardoned two turkeys, Chocolate and Chip. The two holiday birds hail from a ranch in Monroe, North Carolina.
In 2022, President Joe Biden pardoned two turkeys, Chocolate and Chip. The two holiday birds hail from a ranch in Monroe, North Carolina.

Landsat 9 Captures Hurricane Ian Aftermath (Sanibel Island)
Landsat 9 Captures Hurricane Ian Aftermath (Sanibel Island)Landsat 9 captured this image of the aftermath of Hurricane Ian in southwestern Florida on the morning of October 6, 2022. Sanibel Island is shown in the center, with breaches in the Sanibel Causeway that connects the island with the mainland. (White clouds also appear in this image.)

Landsat 9 Captures Hurricane Ian Aftermath (New Smyrna Beach, FL)
Landsat 9 Captures Hurricane Ian Aftermath (New Smyrna Beach, FL)Landsat 9 captured this image of the aftermath of Hurricane Ian in eastern Florida on the morning of October 6, 2022. It shows the coast and New Smyrna Beach, which experienced extensive flooding.

Landsat 7 Captures Hurricane Ian Aftermath (Sanibel Island)
Landsat 7 Captures Hurricane Ian Aftermath (Sanibel Island)Landsat 7 captured this image of the aftermath of Hurricane Ian in southwestern Florida, including floodwater and sediment in the ocean, on the morning of October 2, 2022. Sanibel Island is shown at the center with Fort Myers Beach and Cape Coral to the right. Naples is the gray urban area in the lower right.

Landsat 7 Captures Hurricane Ian Aftermath
On October 2, 2022, this gap-filled Landsat 7 image captured brownish-black sediment runoff from rivers and streams on the southwest coast of Florida. These are the first Landsat images after Hurricane Ian devastated the area on Wednesday, September 28. Water runoff can carry away debris, fertilizers, metals, and other pollutants.
On October 2, 2022, this gap-filled Landsat 7 image captured brownish-black sediment runoff from rivers and streams on the southwest coast of Florida. These are the first Landsat images after Hurricane Ian devastated the area on Wednesday, September 28. Water runoff can carry away debris, fertilizers, metals, and other pollutants.

Landsat Aquatic Reflectance of Lake Erie
A Landsat 9 natural color image (left) and the corresponding Landsat Provisional Aquatic Reflectance product (right) display the properties of a massive algal bloom across the surface waters of Lake Erie on September 9, 2022.
A Landsat 9 natural color image (left) and the corresponding Landsat Provisional Aquatic Reflectance product (right) display the properties of a massive algal bloom across the surface waters of Lake Erie on September 9, 2022.

Collection 1 Datasets To Be Removed by End of 2022
Collection 1 Datasets To Be Removed by End of 2022By the end of December 2022, all Landsat Collection 1 data and science products will be removed from USGS data access platforms. This depreciation includes Level-1, Level-2, Level-3, and ESPA- related products. Collection 1 has not been updated with Landsat products since December 31, 2021.

Landsat Science Team August 2022
The Landsat Science Team met at the USGS EROS Center August 9-11, 2022. Visit the Landsat Science Team Meeting — August 9-11, 2022 webpage to view the agenda and download presentations.
The Landsat Science Team met at the USGS EROS Center August 9-11, 2022. Visit the Landsat Science Team Meeting — August 9-11, 2022 webpage to view the agenda and download presentations.

Landsat 7 Image of the Vall d'Ebo Fire near Pego, Spain
Landsat 7 Image of the Vall d'Ebo Fire near Pego, SpainLandsat 7 image acquired on August 14, 2022 showing the Vall d'Ebo Fire near Pego, Spain. The gap-filled image is shown using the short wave infrared, near infrared, and red bands (Bands 5|4|3). This image was acquired as part of the Landsat 7 extended science mission which acquires data at 8 kilometers lower than the original science mission.

Landsat 7 Image of the Vall d'Ebo Fire near Pego, Spain
Landsat 7 Image of the Vall d'Ebo Fire near Pego, SpainThis Landsat 7 image showing the Vall d'Ebo Fire near Pego, Spain was acquired on August 14, 2022 . The gap-filled image is shown using the short wave infrared, near infrared, and red bands (Bands 5|4|3) which makes it easier to distinguish the recently burned landscape.

Dynamic surface water maps of Canada from 1984 to 2019 Landsat satellite imagery
Dynamic surface water maps of Canada from 1984 to 2019 Landsat satellite imageryThis paper presents dynamic surface water products over Canada from the first in a series of satellite sensors that will be used to develop a multi-sensor dynamic surface water monitoring system. The dataset uses 1984 to 2019 Landsat data to create annual water masks, inundation frequency and wetting/drying trends.

Landsat Collection 2 Provisional Aquatic Reflectance Example
Landsat Collection 2 Provisional Aquatic Reflectance ExampleA portion of the Chesapeake Bay, and the entire Delaware Bay can be seen in these images, comparing the Landsat 9 Level-2 Surface Reflectance product (natural color, Bands 4,3,2) (left), and the corresponding Collection 2 Provisional Aquatic Reflectance product (Red Band 4 at 655nm) (right) for Landsat 9 Path 14 Row 33 acquired February 10, 2022.

Landsat 9 Image of Aorounga Crater
The Aorounga Crater located in Chad, Africa is a large impact crater that appears as a circular depression surrounded by a raised rim, as seen in this Landsat 9 image. The crater is surrounded by a vast expanse of desert and is known for its unique rock ridges, known as yardangs.
The Aorounga Crater located in Chad, Africa is a large impact crater that appears as a circular depression surrounded by a raised rim, as seen in this Landsat 9 image. The crater is surrounded by a vast expanse of desert and is known for its unique rock ridges, known as yardangs.

Landsat 9 Image of Kangerdlugssuaq Glacier, Greenland
Landsat 9 Image of Kangerdlugssuaq Glacier, GreenlandNamed after a Greenlandic word meaning “large fjord,” Kangerdlugssuaq Glacier is one of the largest tidewater outlet glaciers in Greenland. It flows from the fjord of the same name, the second largest found on the east side of the island. This false color Landsat 9 image was acquired July 29, 2022, using Bands 5|4|3.
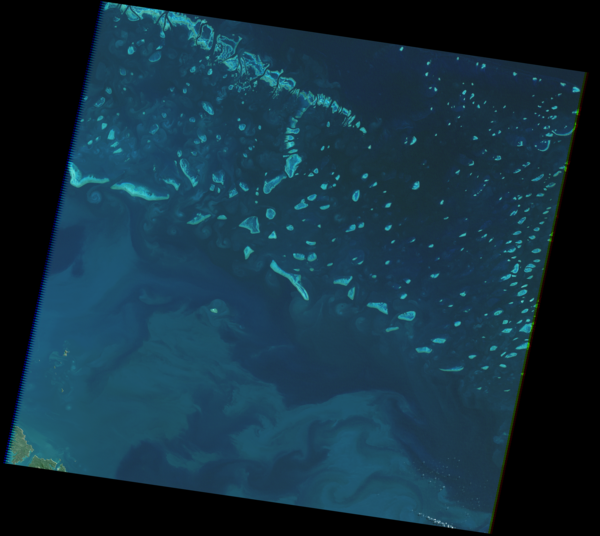
Landsat 7 View of the Great Barrier Reef, 2002
Landsat 7 captured this natural color image of Australia’s Great Barrier Reef on July 24, 2002, using the red, green, and blue bands. The scene (Path 91 Row 75) reveals the reef’s intricate coral formations and the swirling patterns of sediment and currents in the Coral Sea.
Landsat 7 captured this natural color image of Australia’s Great Barrier Reef on July 24, 2002, using the red, green, and blue bands. The scene (Path 91 Row 75) reveals the reef’s intricate coral formations and the swirling patterns of sediment and currents in the Coral Sea.

Special Issue: Landsat Update 50th Anniversary
Landsat Updates are prepared periodically and distributed electronically to provide information about Landsat activities and related topics of interest. Read this issue here.
Landsat Updates are prepared periodically and distributed electronically to provide information about Landsat activities and related topics of interest. Read this issue here.

Example of the Landsat Collection 2 Provisional Evapotranspiration science product
Example of the Landsat Collection 2 Provisional Evapotranspiration science productExample of the Landsat Collection 2 Provisional Evapotranspiration science product for agricultural fields on the Fucino plain near San Benedetto dei Marsi, Italy. Left: Landsat 9 Collection 2 Natural Color Surface Reflectance Image. Right: Landsat 9 Collection 2 Actual Evapotranspiration Image.

Example of the Landsat Archive Dashboard Graphics
The Landsat Archive Dashboard allows users to understand the temporal and spatial distribution of the 10 million plus Landsat scenes available through the USGS. Users can use the interactive maps to view the distribution of Landsat Collection 2 data by Path/Row. There are three Landsat archive maps: Landsat 4 – 9 daytime, Landsat 4 – 9 nighttime, and Landsat 1 – 3.
The Landsat Archive Dashboard allows users to understand the temporal and spatial distribution of the 10 million plus Landsat scenes available through the USGS. Users can use the interactive maps to view the distribution of Landsat Collection 2 data by Path/Row. There are three Landsat archive maps: Landsat 4 – 9 daytime, Landsat 4 – 9 nighttime, and Landsat 1 – 3.