Uncrewed aircraft systems (UAS) instrument validation and calibration
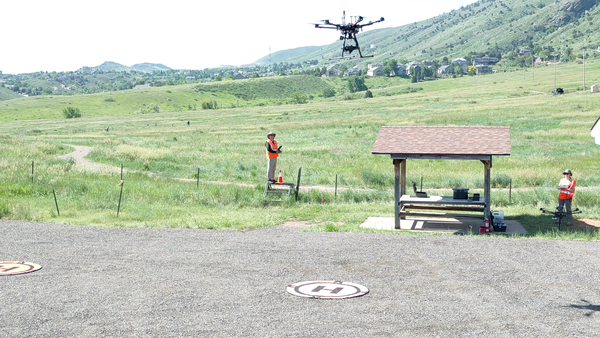
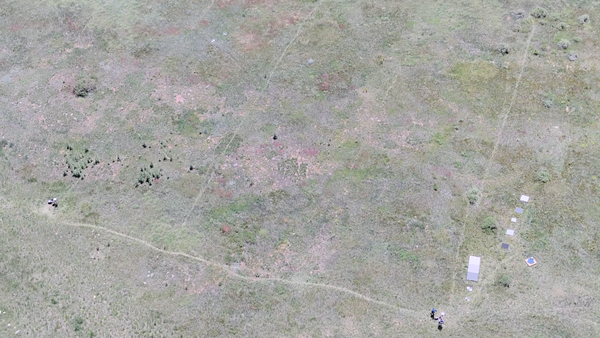
Uncrewed aircraft systems (UAS) instrument validation and calibrationDrone-captured photo of a vegetated field in Golden, Colorado. Faint paths visible across the grass formed from the consistent, repeated pattern walked by a spectrometer operator multiple times per day for multiple days in a row.